
The Livestock complex triggered ‘long signals’ yesterday (4/3/15), across the board (Fed Cattle, Live Cattle, Hogs). As part of the ‘core’ program that I trade, Feeder Cattle is a strong performing market historically:
Trade Analysis: Feeder Cattle – 1 Contract Traded (ex Slippage/Commission)
Duration: 7yrs, 9months
Start-End Equity: 10000 – 84512
Return on Initial Capital: 745.1%
Total Signals: 74
% Win: 55.41%
Avg Win/Loss $: 3245/(1774)
$Win:$Loss: 1.83x
Largest $Win/Loss: 16500/(10437)
Drawdown (Peak-Trough): (19550)
Lets look at the charts….
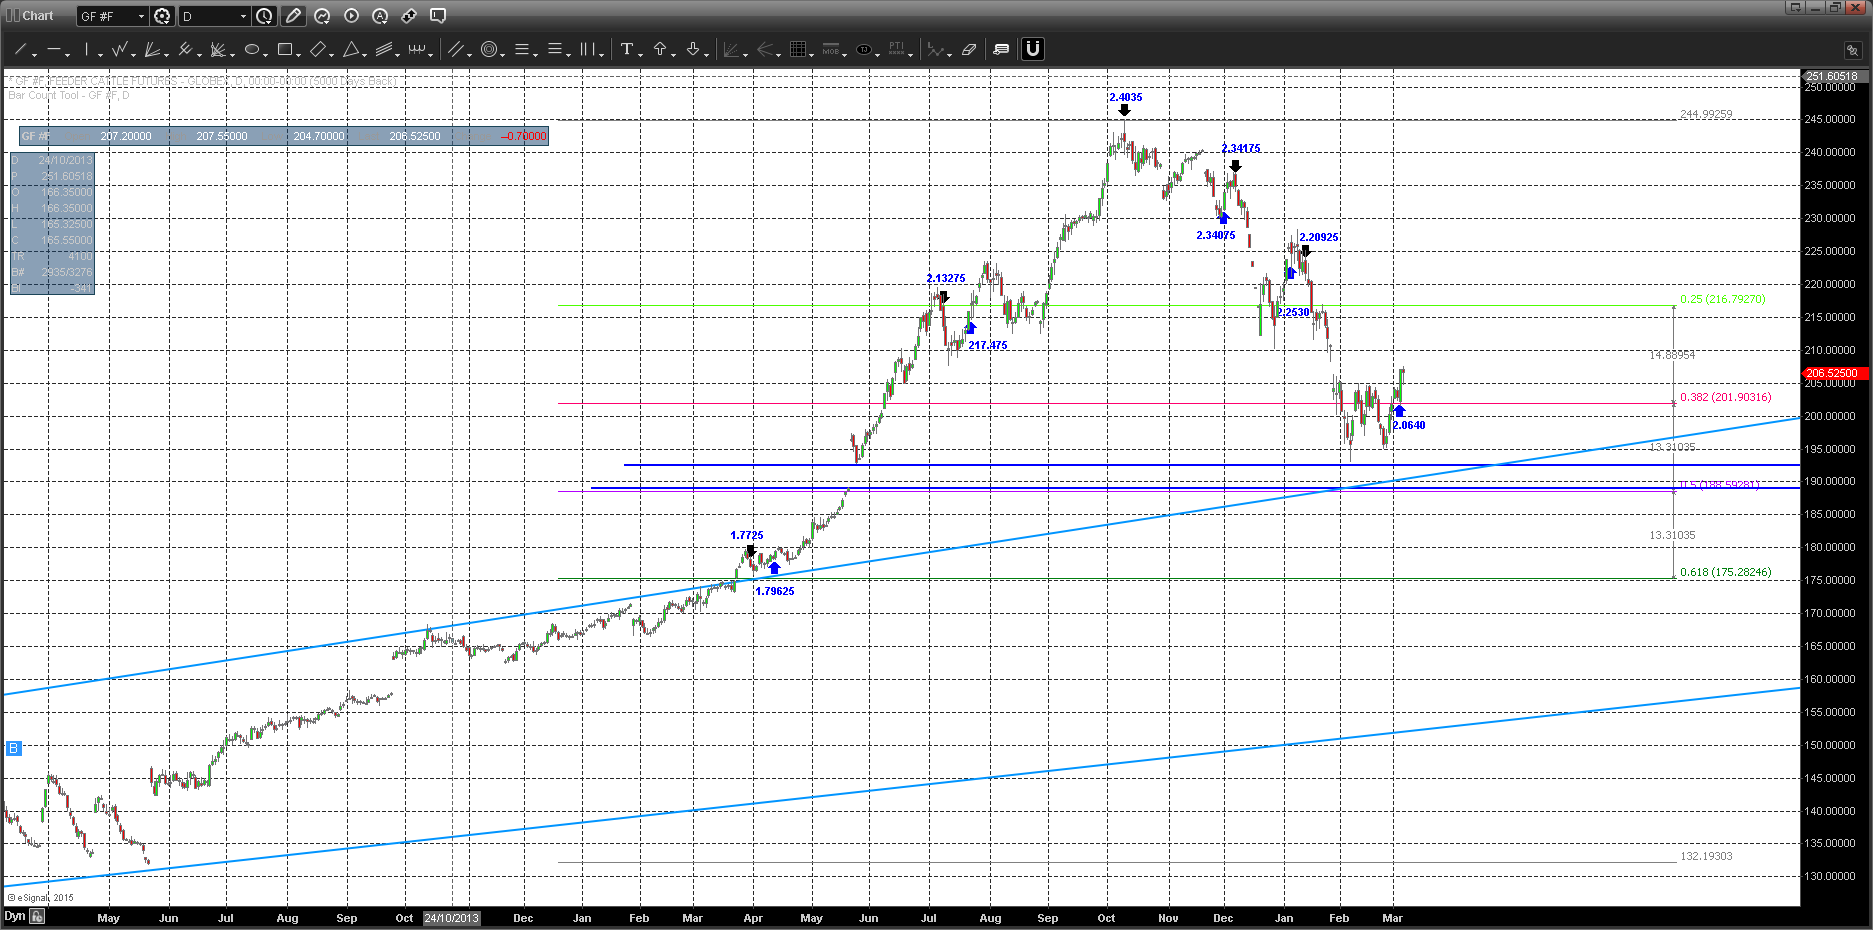
The Continuous Contract chart GF below shows the top of the market Oct 14′ at the 2.40$ level and subsequent roll to the 1.93$ area on the chart. 2 sided trade stabilized the market at the ‘Gap-Area’ 1.90$, intersecting with the near 50% retracement from the May 13′ Extreme Low (1.30$) – Oct 14′ Extreme High (2.40$) and the long term uptrend phase shift line (light blue) traversing through. This area seems to be a logical balance area. Whether the market is ‘ready’ for a retracement rally is in question: contra-seasonal patterns and odds of an intermediate bottom, typically occur in the April time frame, so we may be a bit early and could expect a final move lower into the 1.90$ level for another test. There are other external influences, such as the west-coast port labor disruptions, effecting the off-take, which may force trading partners to look elsewhere for beef short term (ie., China). All that said, the program produces an Average win over 74 trades of .06$/winning trade. The expectancy would take the trade up to the 2.12-2.13. However, the risk is substantial at the sub 1.93 level from here.
I also bought the Hogs market see the chart below:
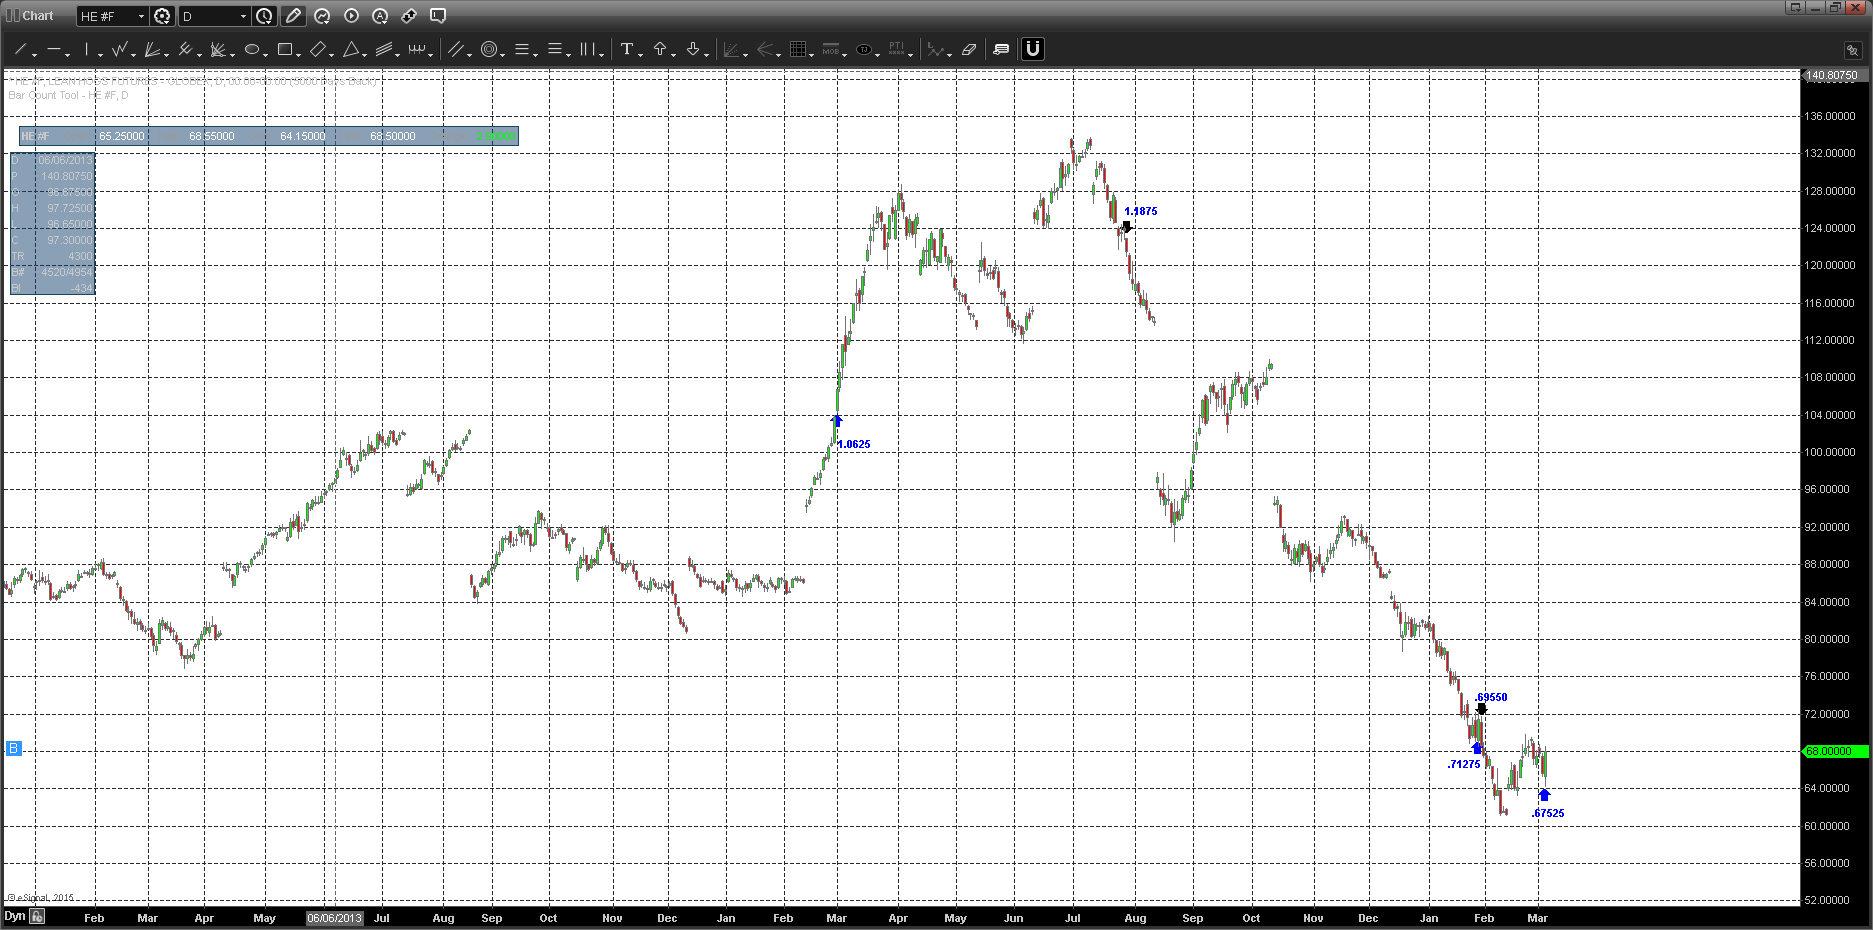
I was trying to buy the market at the last up arrow in Jan at .71$ level and it didn’t pan out, but I went with the subsequent short signal at .69$ and held in to the lows.
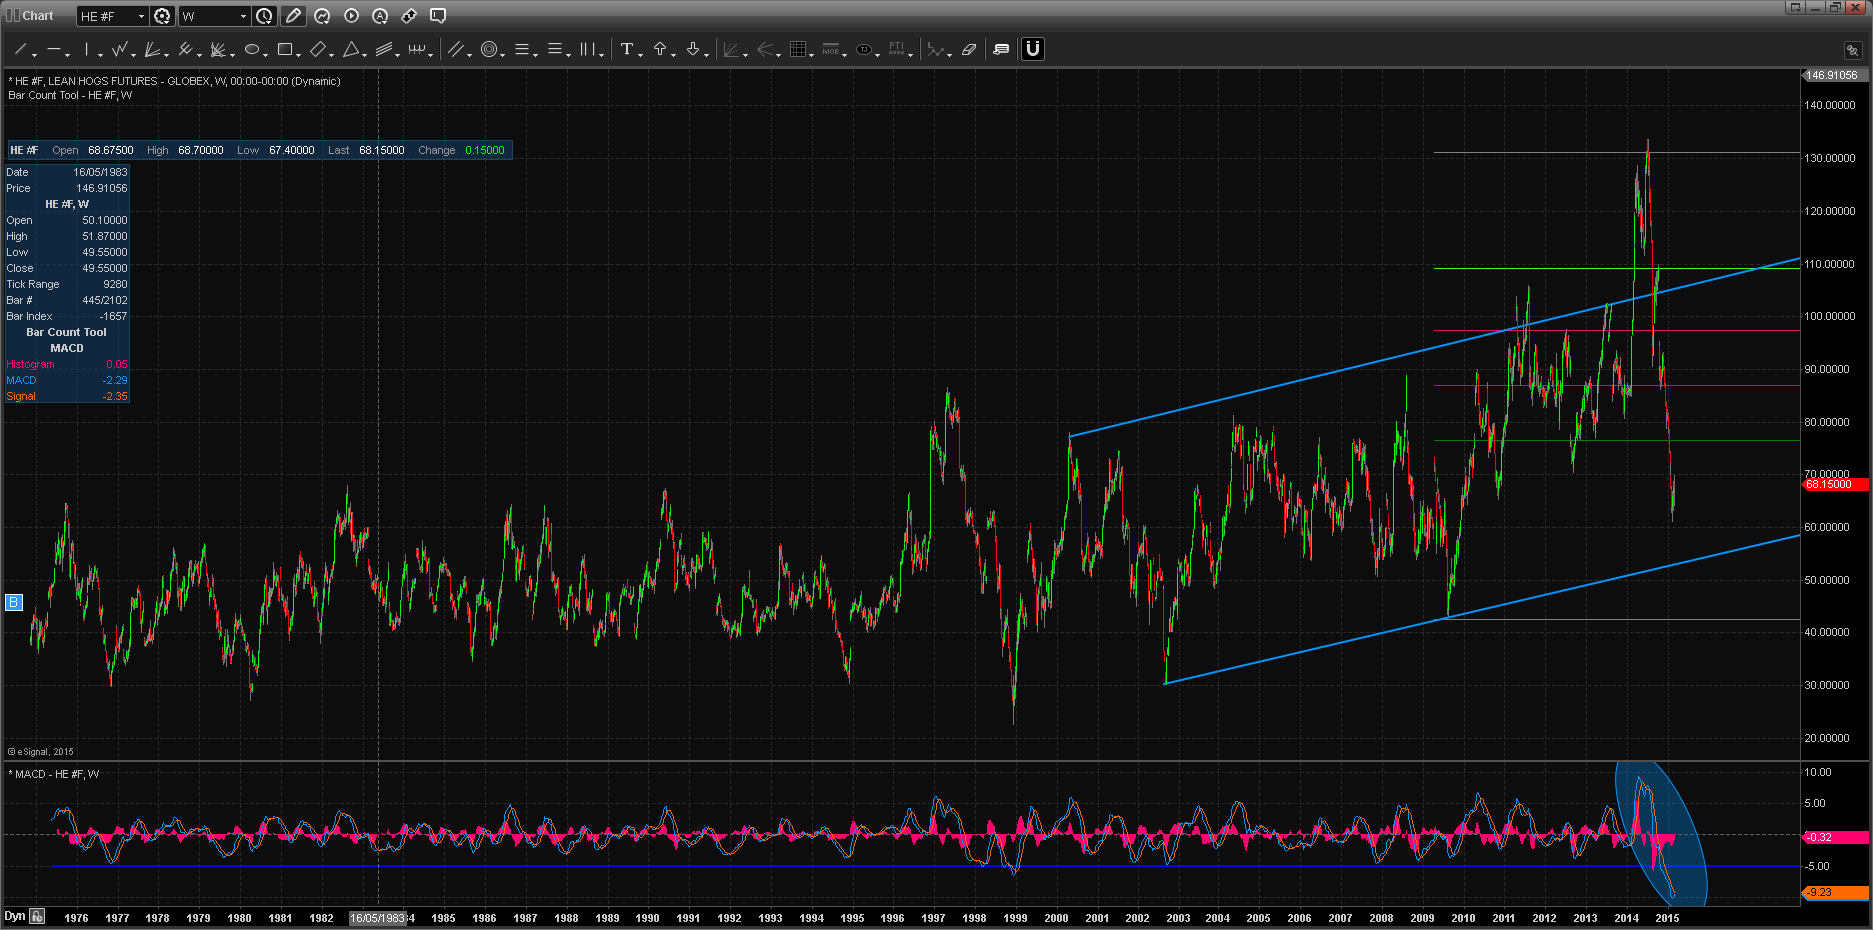
Going back to 75′, the weekly MACD has never been this oversold. The market is approaching long term uptrend line
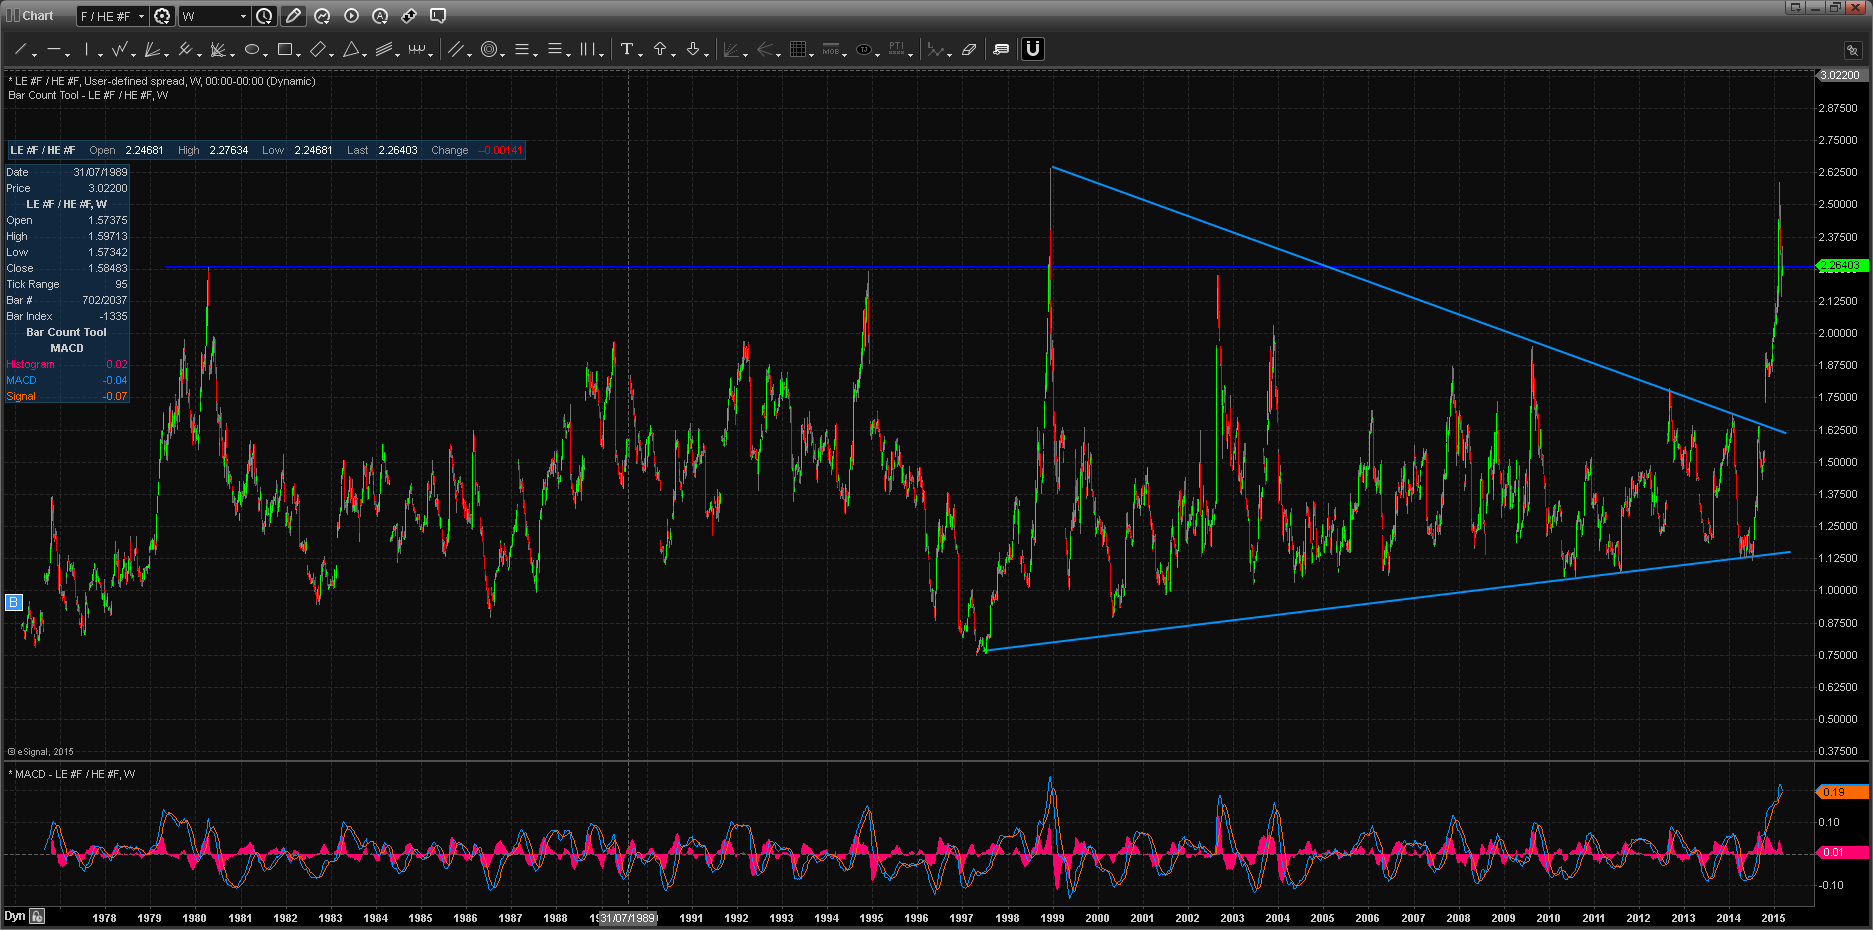
We can also look at the long term Beef:Pork (Live Cattle:Lean Hogs) ratio, in the weekly below: long term breakout from the triangular consolidation in 14′. This chart is very overbought at the 2.60$ retest in 99′ and could be due for rotation back into the pork market vs beef, given the expensive beef prices vs pork.