

By integrating trading timeframes as discussed, one begins to discover the contextual road-map of the markets condition. This provides levels by which we can define trade expectation – risk and reward objectives – which flows into increasing trade conviction when derived from a ‘sound’ framework by which trade ideas are defined, whether discretionary or systematic.
This first part of this tutorial is to help create market context by understanding market structure.
Macro-Market Structure:
Macro-market structure identifies market ‘conditions’ derived from the activity of larger trading time-periods (ie., weekly, monthly, quarterly). As mentioned, characterizing market-behavior using larger trading time periods serves a dual purpose: to define trading parameters of expectation and risk, and to promote meaningful representation of the prevailing market bias. The idea is to step back and visualize a chart from a macro structural perspective (top-down structural). We can visually overlay multiple long-term trading time periods on a single day chart for an integrated perspective of market activity. This becomes the framework for leveraging shorter-term indicators within the scope of larger timeframes of activity – by utilizing long-term boundaries. To further glean the macro-market structure requires defining a set of rules to identify trending vs non-trending market conditions.
Pivot Bar
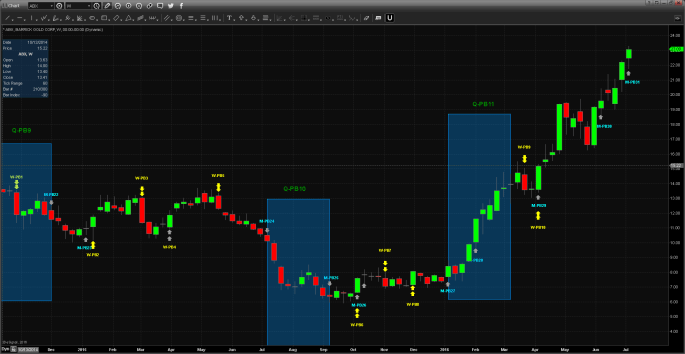
My starting point for defining market structure is to identify the ‘pivot bar’ on the chart. The ‘pivot bar’ is the leading directional bar, because its closing price has exceeded the highest or lowest price of the previous ‘pivot bar.’ This ‘new’ ‘pivot bar’ or leading bar (in an up/down trend) is important because its high and low price establish new high-low price parameters by which future price bars must exceed to sustain directional movement.

The monthly chart above shows the ‘pivot bars’ (PB1-PB10) in ABX since 2008, and identified by gray arrows. In order for PB2 to establish itself as the directional ‘leader’ its closing price must have exceeded either the high price or the low price of PB1. PB2 closed outside and above the high price of PB1, establishing an up-trend on the monthly chart. PB3 closed outside and below the low price of PB2, establishing a down trend, or a new condition on the monthly chart. This condition however was reversed by PB4, re-asserting the up-trend condition in ABX on the monthly chart. PB4 initiated a longer term up-trend to PB7, as a series of pivot bars (PB4-7) firmly fixated the longer term up-trend in ABX.
Three consecutive monthly bars H-L price can be grouped to form a Quarterly price bar. Applying the same logic as the monthly chart above, we can establish a quarterly trend-condition for ABX as seen below:

From the chart of ABX above, the Quarterly units have been grouped according to the blue boxes and subsequent labels (Q-PB1 – Q-PB11) in green. I have retained most of the monthly PBs, referenced by M-PB (Monthly-PB). The extreme H-L of the quarterly units establishes boundary price H-L for the quarterly market structure. Q-PB2 closes outside and above the highest high price set by Q-PB1 to re-assert the up-trend in the quarterly timeframe. Q-PB2 H-L price represents the ‘new’ structural boundary for the quarterly timeframe. Q-PB3 continues quarterly trend development as its closing price exceeds the highest high price from the Q-PB2 unit. Q-PB4 initiates a down-trend in ABX as the closing of this unit exceeds the lowest low price since the Q-PB3. Q-PB4 sets in motion a quarterly down trend that persists to Q-PB11 (2012-2016). I have indicated the ‘Inside Q’ (Inside quarters) denoted by the red box as directionless consecutive quarters in the context of a down trend, which is re-established by Q-PB8. The quarterly time frame of the market demonstrates more imbedded directional activity and establishes important boundaries that would imply meaningful changes in direction over longer periods of time. As an investor, it may be prudent to leverage quarterly price bars as a system to define changes in longer term trend or bias. A short-term trader may elect to use price boundaries from the quarterly or monthly time period to define trade-risk. If the market were to exceed these parameters, a stop would be triggered. If the quarterly trend is down, and the price rallies back up to the quarterly pivot bar high price (Q-PB), and fails, short term indicators could be used to enter a short position, using the upper price boundary as the reference to establish trade risk.
The weekly structure can be illustrated in the same way as the monthly and quarterly have:
In the Weekly chart above, I have retained the quarterly + monthly pivots from the previous exercises, and added the weekly pivot bars that initiated weekly trend changes only as per the yellow-double arrows (and yellow label). Using the weekly chart we can drill down in our macro-market structure focus to view a faster structural trend indicator in the weekly timeframe. W-PB6 can be referenced as the initiator of the weekly directional change-up from W-PB5. W-PB6, however, is short-lived and reversed to weekly down by W-PB7, and then W-PB8 turns the weekly trend up to W-PB9. The faster weekly trend-structure can be used to position ahead of longer term time period trend changes, such as monthly or quarterly time frames. We can observe the W-PB8 anticipate the up-trend move ahead of the M-PB27 (Monthly up trend) and the Q-PB11 (Quarterly up trend). A longer term investor could use the weekly trend structure to anticipate longer term trend changes in the market, and once the monthly or quarterly time frame is elected in line with the faster weekly time period, the longer term trader/investor may choose to hold until the quarterly time period turns back down. The short term trader may choose to overlay the weekly time structure in the context of intraday strategies to remain aware of risk and meaningful market change.
The macro-time structure can be integrated onto the day chart or the intraday chart in the form of a channel structure, organizing the PB H-L price into a coherent, visual chart representation as illustrated below:
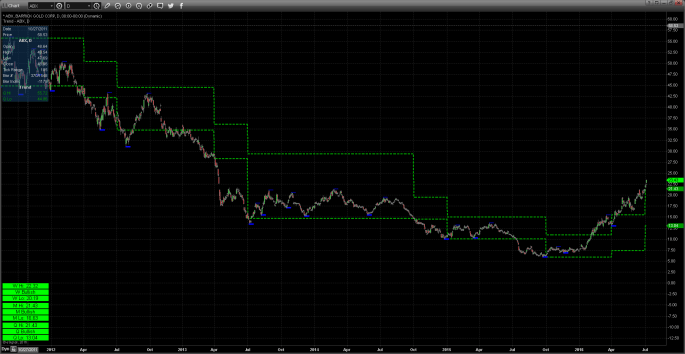
We are now able to visualize the quarterly time structure represented by the green channel above in ABX, as defined by the Q-PBs high-low prices. We can visually recognize individual day-bars in approximation to the quarterly time structure. In the context of the quarterly down-trend, we can observe that the day-bars gravitate to the lower boundary of the quarterly channel. Trading opportunities may present as the day bars re-approach the upper quarterly channel boundary as short sales, used in line with other short-term trading indicators.
The chart below has now incorporated the monthly channel boundary as defined by the M-PB high-low prices from previous charts in conjunction with the quarterly channel, as overlaying the day bars:

Finally, we can observe the weekly channel structure below as per the yellow overlay on the day chart:
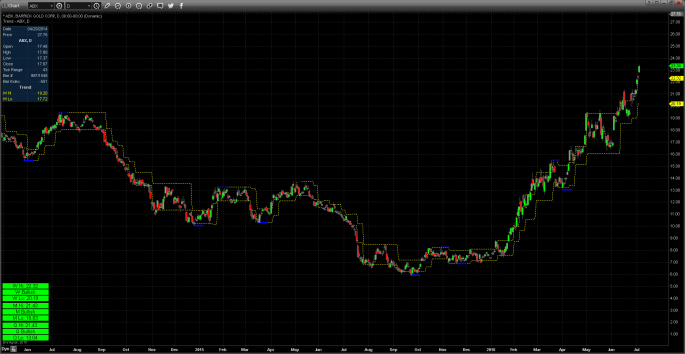
The weekly channel can be used as an indicator in and of itself, by leveraging the direction of the longer time frame trends, such as the monthly and quarterly. Say the monthly and quarterly trends are bullish, in the context of a weekly bullish trend structure – all timeframe aligned bullishly – the trader could buy the market on pullbacks to the weekly channel low boundary structure. In this context, the trader may be focused on buying the dip of the weekly timeframe. This could be implemented simply by buying a 2-3 day consolidation pattern in approximation to the weekly lows.
When the time channels are mixed in trend, such as the case when quarterly=bullish, monthly=bearish, and weekly=bullish, the trader would have to use the longer time channel as the imbedded directional bias of the market; ie., quarterly = bullish, and use opportunities to trade both long and short, as the timeframes indicate a sideways or undecided condition where range-bound trading may be highly profitable.
These are very clear, simple instructions for determining which way a market is moving directionally or not and makes it very easy to assess the inter-relationships of trending conditions across different trading time frames. More importantly, having the advantage of observing longer duration price references from larger time frames at the day chart level gives the trader structural context on the day chart and simplifies the process of classifying trends.
Micro-Market Structure
Developing a tactic to anticipate Weekly and Monthly trend-change is the piece that every short-term trader looks for. This determines precisely the timing of the trade, directional commitment to the idea and trade risk. This is the component that offers the least reliability.
I was able to develop my ideas of macro-trend and macro-market conditions from the Weekly, Monthly and Quarterly pivot bars, but I struggled to develop a faster entry-exit procedure, that could be seamlessly integrated into smaller or shorter term trading time frames reliably (hourly, 30mins, 15mins). I attempted to integrate several conventional technical indicators into my macro-framework, but none offered the agility and flow that could capture and anticipate market swings. It may sound naïve to expect trade certainty in the market, but I was looking to create a procedure that would quite predictably identify short-intermediate term price swings in any market, reliably. More definitively, we would need a sensitive rules-based approach with a high degree of accuracy to minimize the false-positives and false-negatives associated with erratic price movements (false-breakouts/breakdowns). In essence, we want the indicator to capture meaningful short-intermediate term high and low pivots, or reversals, and by the same token have a high degree of specificity – knowing when a price reversal or pivot may be uneventful. When you visually inspect any chart timeframe, identifying the high and low inflections, is the objective of an ‘intelligent’ rules based system from the perspective of positional trading; an indicator that moves with the developing market predictably.
My micro-method came to me through Mark Fishers book, The Logical Trader. In it Mark discussed what he called the ‘Daily Pivot’ which I now refer to as the ‘Daily Pivot Range’— a statistical representation of previous trading day’s mean price, +/- standard deviation, which may be extrapolated over any number of days. This simple idea allowed me to develop an understanding for the markets propensity to micro-trend or adhere to the same macro-principles that govern directional movements over longer timeframes, as described. The interaction of price and the regression indicator shows quite clearly that price movements are seemingly organized.
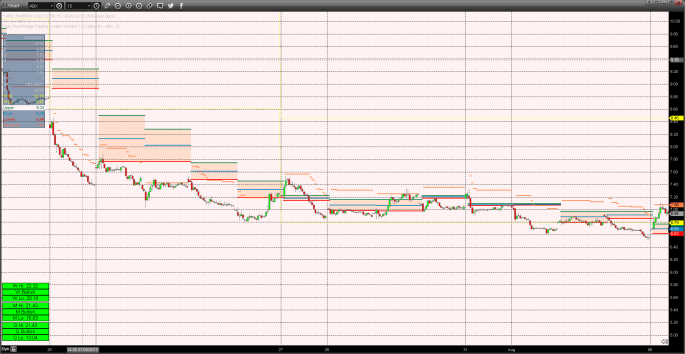
The above intraday chart of ABX shows the ‘Daily Pivot Range’ indicator represented by the structure trailing (below) the price bars; the upper/lower boundaries of the structure reflect standard deviation of trailing price and the blue dotted line in the middle is the mean price, representing the fair value (FV) of price over a 3 day period, but it can be used to statistically montior FV over any number of days (‘x’ days). We can observe that based on the 15 min intraday chart of ABX, over a period of 15 trading days, price trades consistently above or trends above the ‘Daily Pivot Range’ indicator, which appears to be a logical price movement over 15 trading days. But this demonstrates albeit a small slice of time that short-term price movements have the ability to persist.
The above chart shows a short-term intraday chart (15mins) of ABX with the same ‘Daily Pivot Range’ indicator overlaying the price, with the leading indicator to the downside. The price tends to remain below the short term structure, again for 14 consecutive trading days, quite predictably.
Both of the previous examples show that a market may have the tendancy to coherently mico-oscillate for a given short period of time. In the above example of ABX, the trader can make an assumption or a rule that IF the price bars transition ‘above’ the ‘daily pivot range’ (defined over some interval of time ‘x’ and using the intraday price data as defined by this chart), AND satisfying some defined time period by which price must trade (above the daily pivot range) THEN it may be such that price on a short term basis is preparing to persist or trend. Now, the micro-trend rule, just described can be integrated into the macro-market structure by way of overlaying the quarterly, monthly or weekly market structures as described onto the micro-structure (intraday chart) as a way of gaining additional perspective of the trade – trade risk and reward (expectation).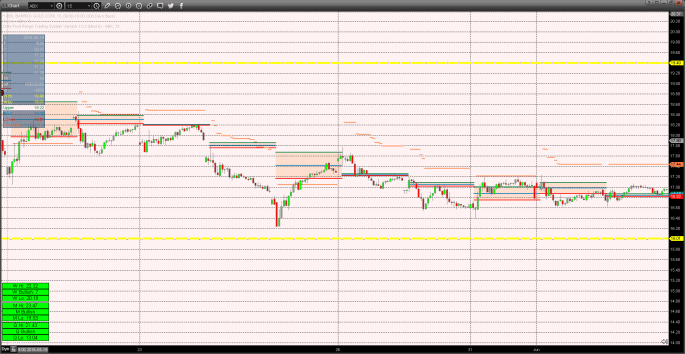
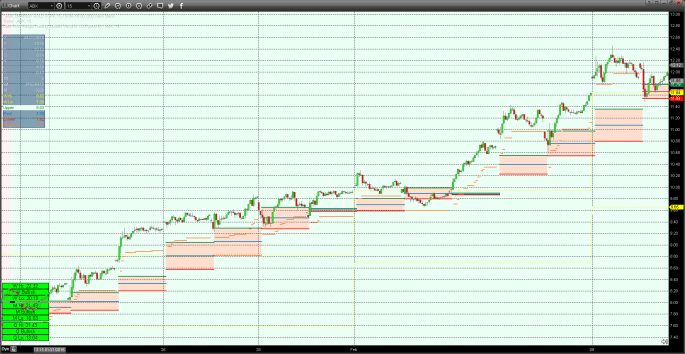
From the image of ABX above, we have another snapshot of the interaction of price and the ‘daily pivot range’, but now we get to observe the ‘weekly’ trend structure as per macro-structure discussion above, by the ‘yellow’ channel overlay. From left to right, we can observe price moving lower, leading the daily pivot range micro-strucutre lower suggesting a short term down trend in effect, but as the price approaches the yellow weekly lower channel boundary (or the weekly low structural level), there is some hesitation in price to advance lower. That is, the price consolidates at this level, a rational or logical behavior, as weekly support has been achieved. By visualizing the weekly low channel boundary overlayed onto the intraday chart, we can now improved our vantage point and perspective of what price is doing and may be expected to do at this more critical level.

The chart above shows a continuation in price of ABX from the previous price consolidation at the weekly low level. By knowing ahead of time that the weekly structure of this particular market is bullishly aligned (or trending), we can make an assumption that price may more predictably find support at this level, and begin to re-assert itself higher, as it does in the chart above. We can observe that the price gaps higher, challenging the weekly high boundary price (as per the yellow channel line), exceeding that level, re-initiating the bullish up trend in price. The perspective of the weekly structural support and resistance boundary (in yellow) in relation to the intraday price bars can more effectively influence trade risk. And so the trader can begin to position himself in line with the intermediate time frame of the market, defining his risk by the yellow weekly channel boundary in the event a long position is taken.
We have now observed how micro and macro market time frames can be interwoven to not only support profitable trading, but enhance the measure by which trade-risk and reward are ‘subjectively’ evaluated. From this perspective so far, no additional filters have been used to ‘value’ or ‘qualify’ the price action – simply price alone has been used. The concept behind market-structure supports the idea that plain vanilla price development in and of itself as a method to generate profitable trade patterns and risk-management protocols may be a rational and useful approach to short and intermediate term trading.
MST Proprietary Indicator
I was reflecting on the interaction of price and daily pivot range as discussed for quite some time before recognizing a powerful, high probability interaction that could be further tested as a trend initiator or trend reversal indicator, more reliably. This specific day-type characteristic has become the basis of MST trading algorithm, thus driving the the basis of the strategy. This AHA moment followed my own definition of what my purpose or trading objectives were – to capture short-intermediate term trend changes with a high degree of conversion or accuracy AND that it should be universally applied to’any’ asset market fairly predictably. Having the foreknowledge of my trading time frame ‘sweet-spot’ along with an understanding of my trading style supported my own ability to ‘find’ what I was looking for in the market. By default, that implied an understanding of what I did not want to do as a trader: day-trading price, nor was I looking to be a long term passive investor. And that is how my short term proprietary indicator came to be.
Using all of the logic and reasoning that has been explained, I simply looked for a reproducible set-up that could be strongly associated with the development of a short-intermediate term price trend change. And that could be defined by a momentum-day-profile; more specifically, a day-type characteristic involving price-action that would result in a complete reversal from price trading above the daily pivot range, to price trading below it (and vice-versa – from below the pivot to trading above the pivot range), with a sub-condition on ‘how’ the market closed in the event that this behavior occurs. So if the price bars transitioned intraday from one side of the daily pivot range to the other, and satisfied a closing bar condition, then we may have a higher probability directional change in the market. So the momentum filter offers up a trading day that is more ‘urgently’ associated with volatility as defined by; aggressive buying or short covering in the case of a bullish transition (short term long trend), or the opposite scenario in the event of bearish trend development, such as the case with long-liquidation selling or active shorting. Of course we cannot qualify which characteristic behavior is associated with the day-type, though we can make an assumption. We are more interested in statistically capturing an event as displayed by price action that may be a reproducible phenomenon leading to predictable short term trend change over different market conditions and long periods of time.
Without disclosing the very nature of how the indicator quantifies or evaluates the intraday volatility required to set the condition of a trend reversal or trend initiator day, I have layed the logic behind the conditions that must be met in order for the trade set-up to be triggered.
