
Long signal came in last night in the Lumber market. I do filter O/N market price data in the Lumber market. I noticed the Lumber market was generally ‘quiet’ during the pit session, but would become increasingly active prior to the electronic market close (15:00-17:00), typically with directional follow through into the o/n open at 18:00. So I began tinkering with the momentum data filter and a very different Lumber program emerged. Performance metrics for Lumber, historically are most ‘consistent’ of any market I trade — as the frequency of signals increased, win rate would increase proportionately, which is unusual. Most importantly, Lumber has never drawn down over $53 (x110 /contract = $5830) in a particular consecutive losing streak or on a individual trade over 8 yrs. With the average risk/trade at $10 (x110/contract = $1110), with the average Win:Loss ratio at 2.10x (Win/contract = 2.10x Loss). So this market emerged as a steady long term performing market in the tool kit. Having said all that, you can never implicitly ‘trust’ a market, but the track record is something adds a dynamic of confidence. Unfortunately, market depth has dried up over the years, making it difficult to visualize a real scalable business model in the Lumber market, as average daily volumes have significantly changed, threatening risk due to slippage.
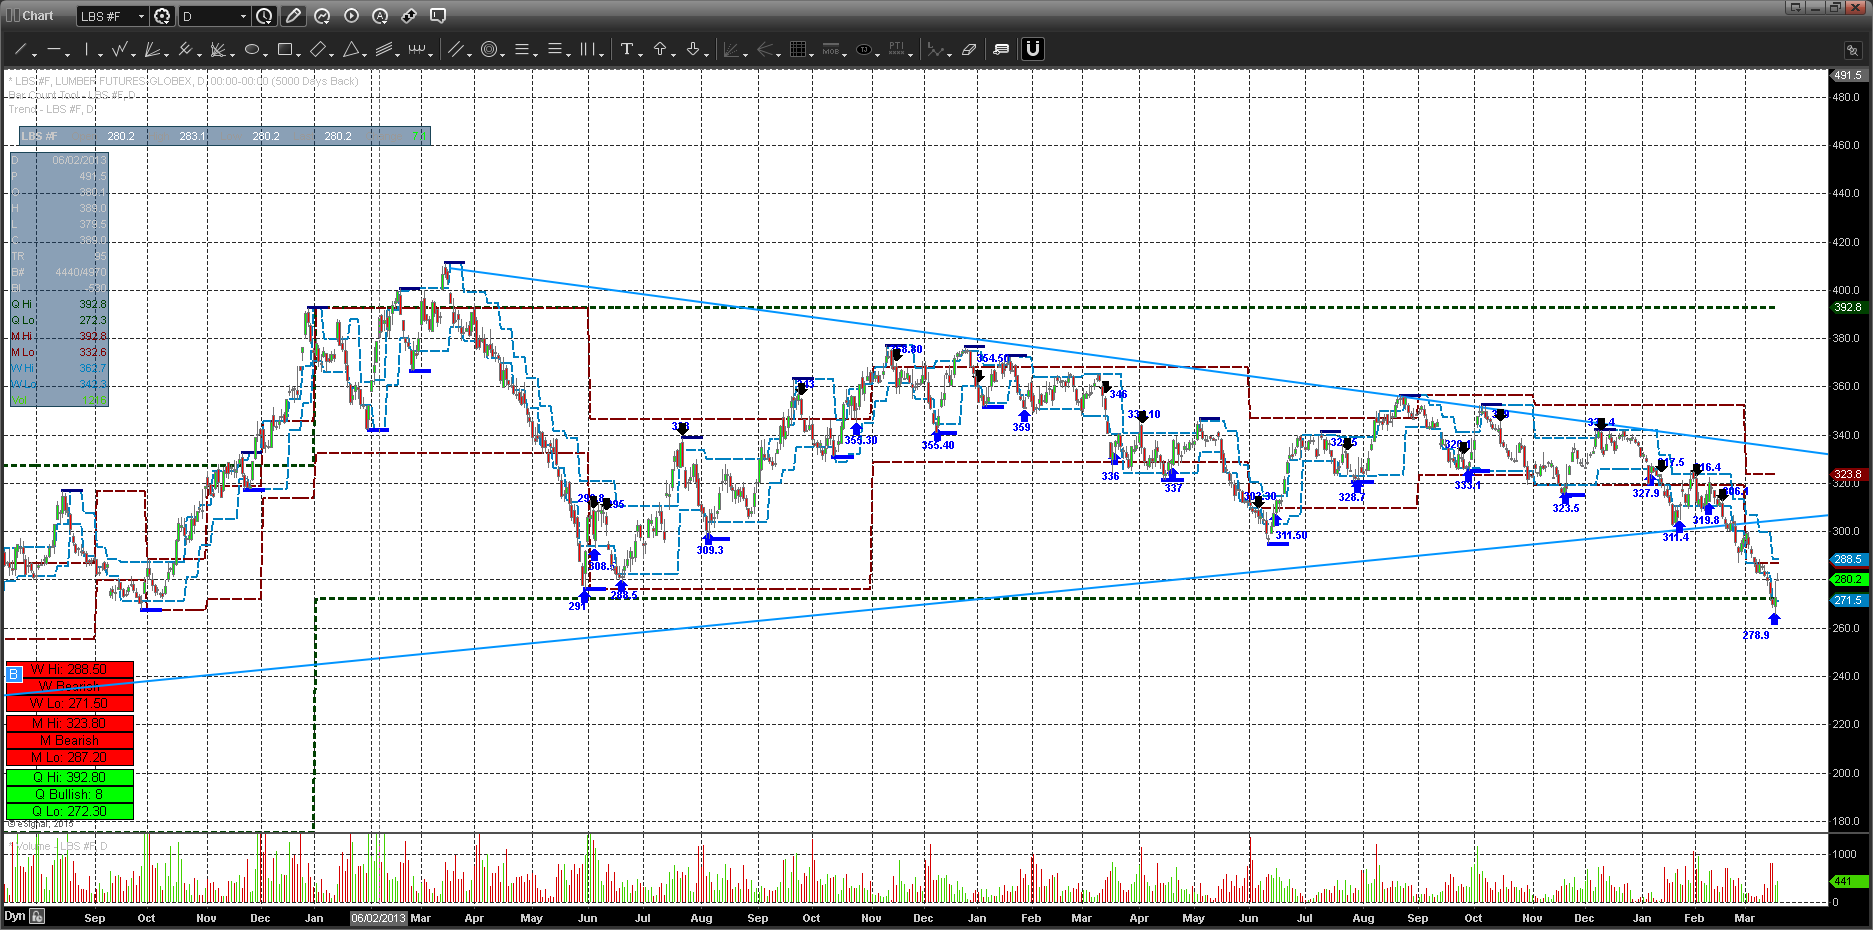
Since mid 2013 Lumber has been maneuvering a tight trading range, approximately $60, which adds some degree of complexity to a short term swing program. Despite that in the past 600 trading days (2.5yrs) the system has produced a 57% win rate. But the trades have been occurring more frequently (Avg Holding over 8 yrs = 17days, Avg Holding 2.5 yrs = 10 days). Looking at the chart below of the cont. contract of Lumber (day), I’ve overlayed all signals, as well as the markets structural boundaries. These are multiple time frame pivot bars, representing Quarterly, Monthly and Weekly price bar data, visually shown as channels (this was the easiest way to develop this concept). Its kind of like taking a slice of the Quarterly, Monthly, Weekly chart and laying it over the day chart. I thought this was an intuitive representational way of depicting larger trading timeframes. The channels are carrying the ‘pivot bar’ H/L price from larger timeframes as per the green (Q), brown (M), blue ![]() lines. The pivot bar is the crucial bar thats acts to initiate directional change. This is the bar that extends a trend, directionally speaking, by closing either higher or lower than the previous bars H/L price. This a plain vanilla way of examining directional impetus at the price level. There is an interesting aspect to this and that is, future price action has the tendency to ‘respect’ the pivot bar H/L price. In other words, there is a cascading effect through the spectrum of trading time frames, whereby prices of longer time frames have more ‘credibility’ than lower or smaller time frames. And so it goes that the shorter time frames tend to respect the pivot boundaries of higher time frames of references. The weekly pivot will oscillate within the context of monthly, and monthly will oscillate within the context of quarterly, until some change in activity from the smallest acting time frame violates the existing boundaries and changes the markets condition as it were. We can see from the chart below of Lumber that the ‘green’ channel line or the Quarterly pivot bar H/L price as represented on the chart has been Sideways for some time, since Jan 2012 — over 3 years now (272 level). We could therefore suspect to see this market find support at the green line — which it did last night. The price in the front month (K5) dipped below 272, traveled to 265 yesterday, and dramatically reversed, rejecting price back above the 272, to go limit up. From the long side of any trade, if you have the opportunity to trade from the support of the Quarterly timeframe, you are in a strong position (low risk). The same logic applies to the Lumber trade yesterday. Any price activity < 272 on a daily and/or weekly closing basis would be deemed very weak. I would suspect this market to bounce around using 272 as support for now.
lines. The pivot bar is the crucial bar thats acts to initiate directional change. This is the bar that extends a trend, directionally speaking, by closing either higher or lower than the previous bars H/L price. This a plain vanilla way of examining directional impetus at the price level. There is an interesting aspect to this and that is, future price action has the tendency to ‘respect’ the pivot bar H/L price. In other words, there is a cascading effect through the spectrum of trading time frames, whereby prices of longer time frames have more ‘credibility’ than lower or smaller time frames. And so it goes that the shorter time frames tend to respect the pivot boundaries of higher time frames of references. The weekly pivot will oscillate within the context of monthly, and monthly will oscillate within the context of quarterly, until some change in activity from the smallest acting time frame violates the existing boundaries and changes the markets condition as it were. We can see from the chart below of Lumber that the ‘green’ channel line or the Quarterly pivot bar H/L price as represented on the chart has been Sideways for some time, since Jan 2012 — over 3 years now (272 level). We could therefore suspect to see this market find support at the green line — which it did last night. The price in the front month (K5) dipped below 272, traveled to 265 yesterday, and dramatically reversed, rejecting price back above the 272, to go limit up. From the long side of any trade, if you have the opportunity to trade from the support of the Quarterly timeframe, you are in a strong position (low risk). The same logic applies to the Lumber trade yesterday. Any price activity < 272 on a daily and/or weekly closing basis would be deemed very weak. I would suspect this market to bounce around using 272 as support for now.