

There appears to be reasonable odds of a short term price bottom in the Euro-Bond space (Long end). Using the systems primary trading vehicle, the French 30yr Government Bond (OAT), today’s session put in a ‘failure condition’, reconfirming the Long Signal entry May 8/15 off the long tailed low inflection point. The failure condition is a false +ve of a short signal that was reversed by the close of the trading day. This occurred today, as global debt markets came under overnight selling pressure, carrying into the open of the US markets. This weakness produced a Short Entry condition in the FOAT. This was reversed, however, as the OAT M5 rallied back (along with the FI space globally) and closed in a position where the momentum filter recognized the statistical nature of the activity as ‘meaningful’, relative to the short term proprietary structure that is used to benchmark and filter price activity intraday. When the French 30yr generates a ‘failed condition’ (a statistical re-affirmation of the prevailing signal, in this case long) there is a 100% win rate over 3 years of data. To boot, French Long Bonds trade summary in the program is as follows (1 lot, ex-slippage, commission)
Trading Period: 3yrs (Start Date: Feb 2012)
Total Signals: 46
Win Rate: 41.3%
Avg $ Win/Trade: $2456
Avg $ Loss/Trade: -$994
$Win/$Loss: 2.47x
Largest $Win: 11,390
Largest $Loss: -$4660
When markets perform with a Win:Loss approximating 3x, then %Win rate can approximate 33% to make an objective 30% Compound rate of return. In other words, losing 2/3 trades (66%), with a 3x win rate can expect to generate ~30% compound over large sample sizes by virtue of gaining back the 30% on a 3x win/loss ratio.
Lets look at the day chart below: we can see all signals generated in the French 30Yr (OATs) reflected by the arrow scheme. There’s no other indicators other than a simple day-volume read. My risk sits below the ‘tail’ at 148 level.
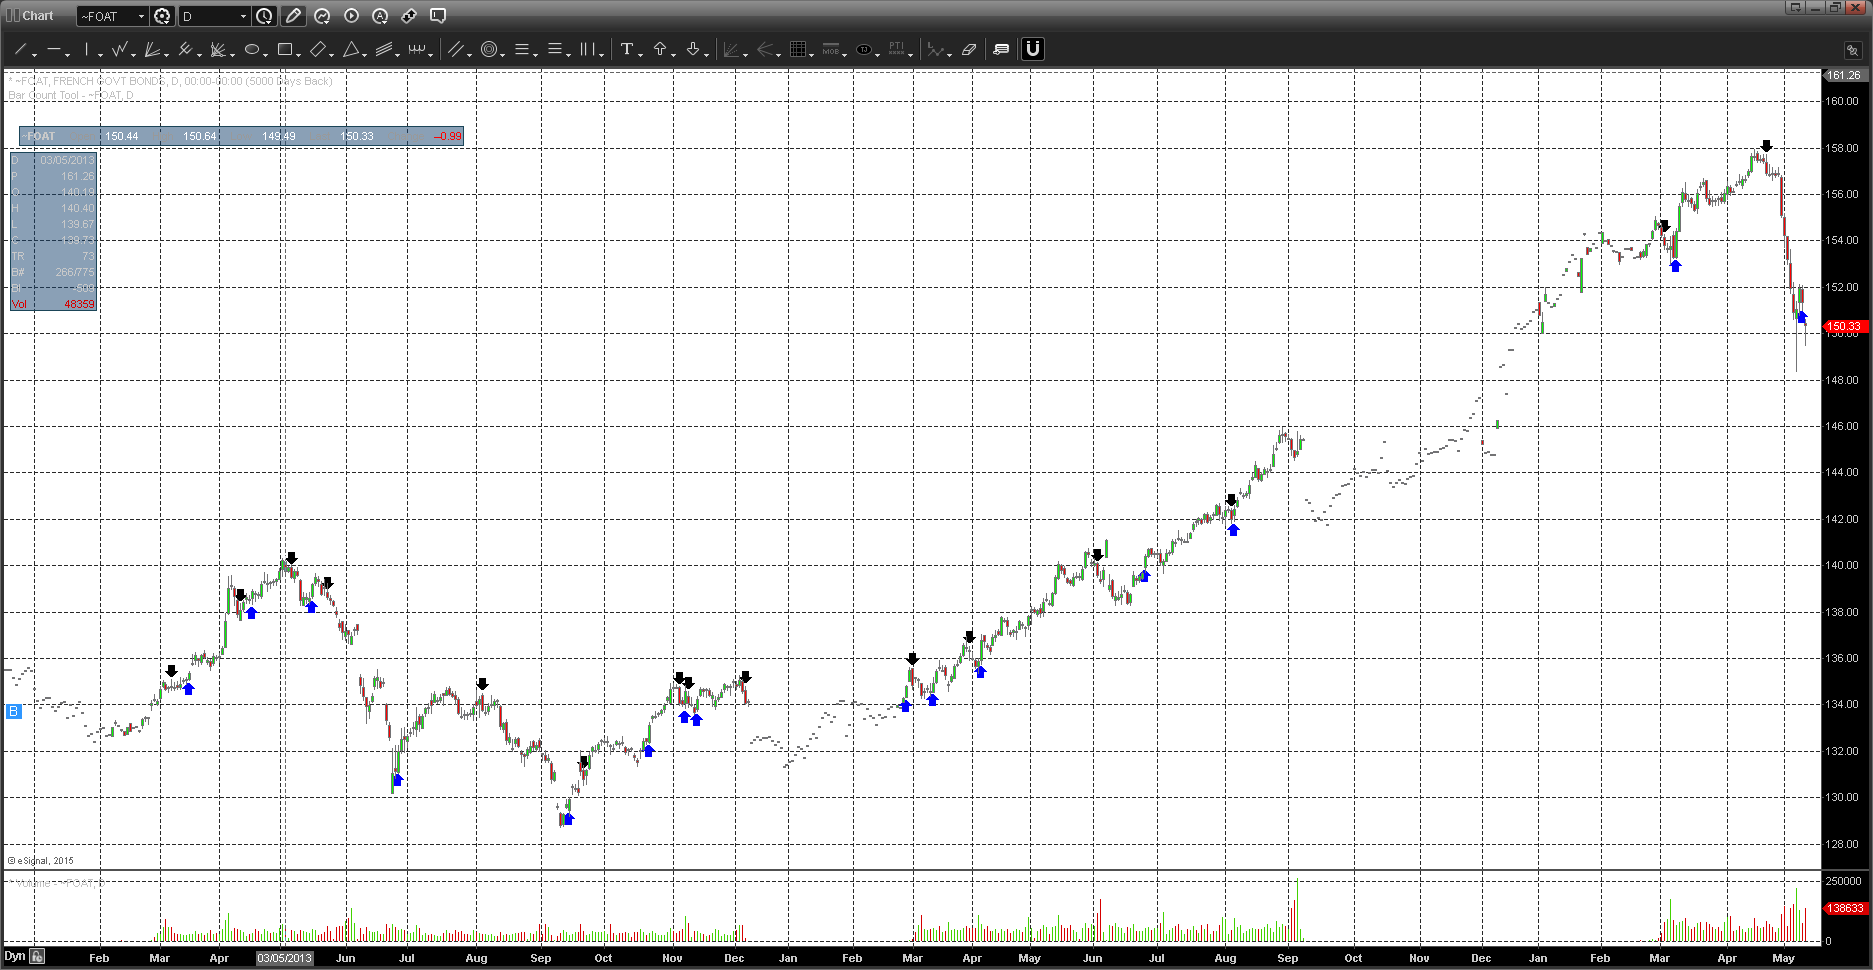
We can view the previous ‘Short’ Signal as per the more recent ‘black’ down arrow at the top of the chart, 158 level. With an exit at the corresponding ‘blue’ up arrow at the 152.02 level (6points/profit = 6000/contract). Euro-zone gov debt ‘crashed’ across the board at the long end, in line with Long term US treasury price. See the German Buxl (30yr bond price below):
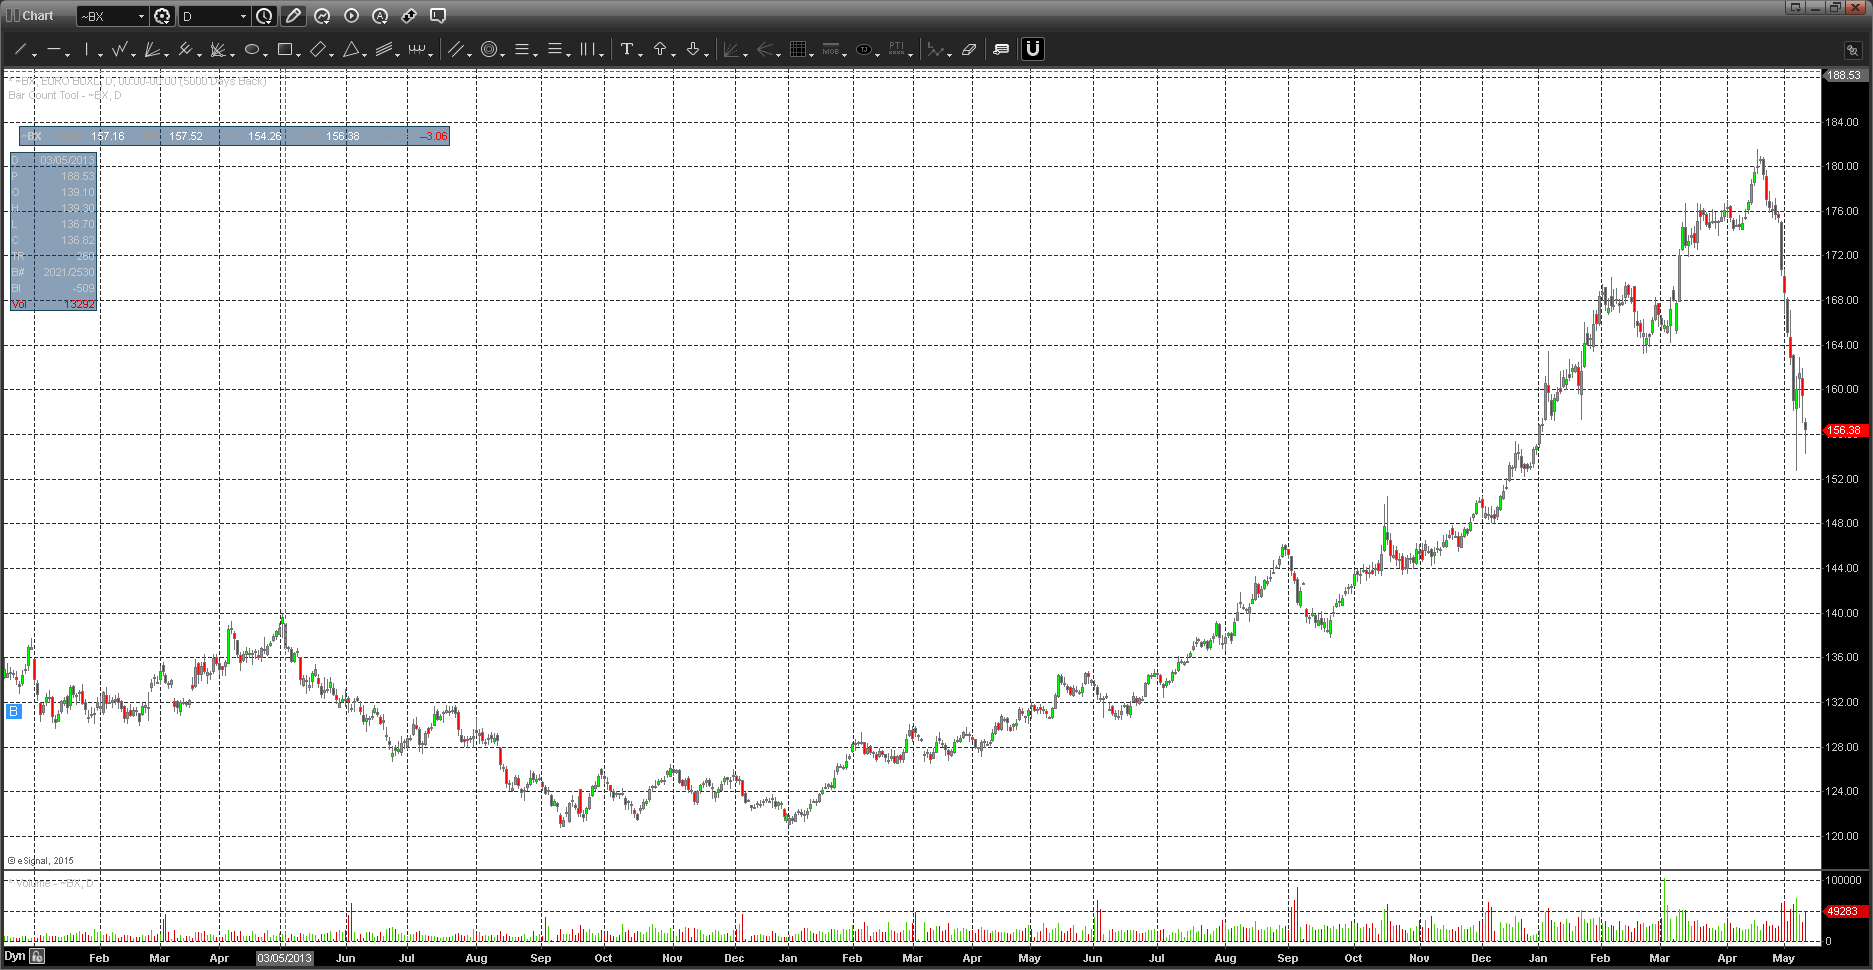
We’ve heard about the ‘trade of the decade’ in Euro-Long term fixed income, as yields went -ve. Look at the short term move down in Buxl price (180 – 152 level) in 2 weeks. I’m also watching system signal breadth across the debt space. The only (long term debt price) market yet to confirm a ‘long entry’ is the US 30yr Treasury Bond. Otherwise, the long trade may be setting up as a quick counter trend trade.
