

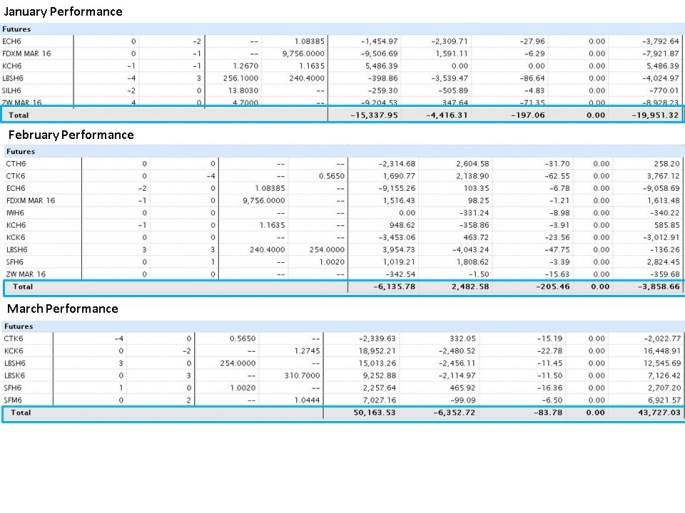
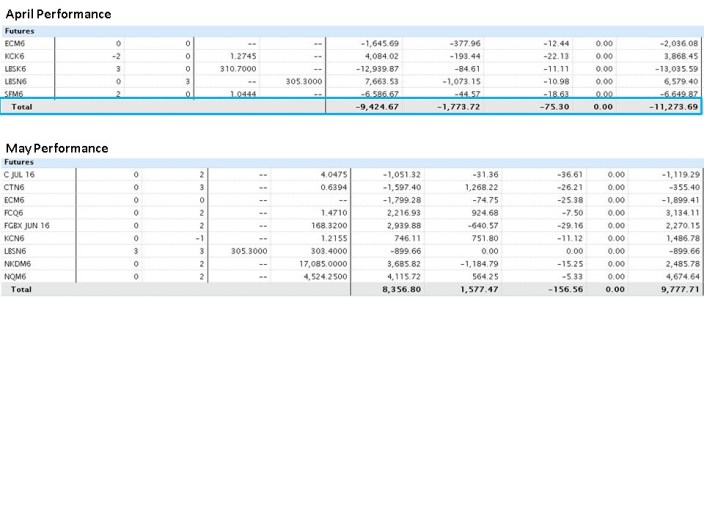
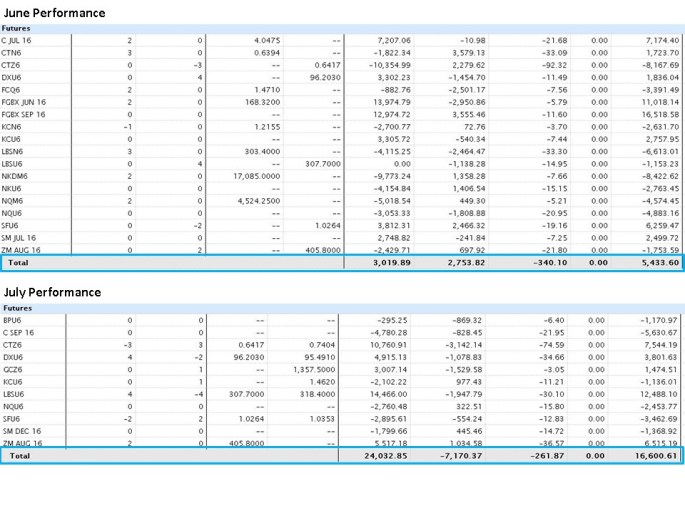
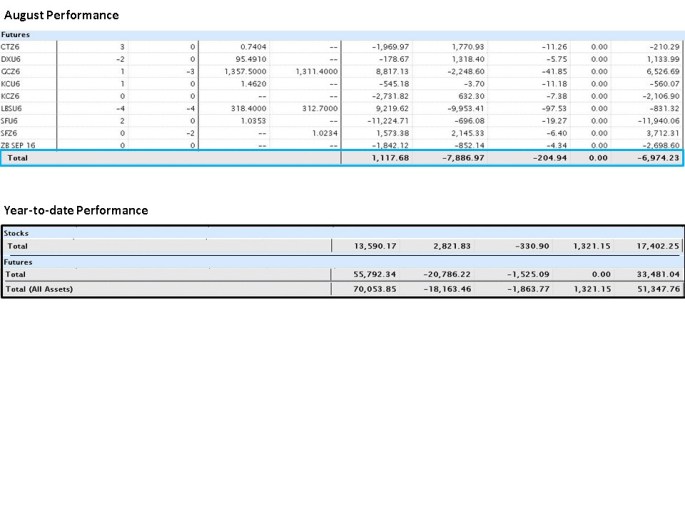
Below, I’ve captured images from my trading statements that reflect MST ‘total P/L’ in 2016: This is a futures program predominantly, however, there are strategic equity-linked ETF products that have found a place in my trading roster of assets. These metrics have not been displayed. I have detailed records of historical monthly performance metrics here; my own PA copied below reflects results using a multi-contract (futures)/market approach (leveraged approach) .
 I am including a table below that displays trading results from previous years using my own leverage model:
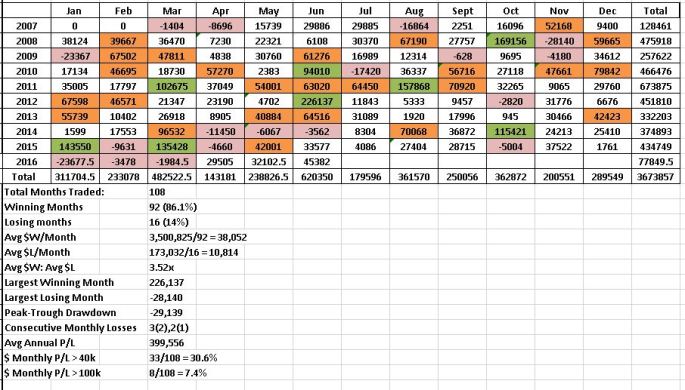
These results indicate that 2016 trading has been a statistically weaker year, as previous years’ mean annual profits have approximated $400,000 (without adjusting the leverage model). The underperformance of 2016 is a function of the complete absence of vol, but may suggest that the system could mean revert over the next 4 months to historical means – or not.
As a systems trader, I am cognizant of the fact that market conditions may be adversely effecting my program alpha, ie., absencve of Vol in 2016 – though it is highly unlikely that these conditions are here to stay. I have tried to mitigate this actuality (egde-erosion) by implenting plain vanilla rules, timeless-rules, as the basis of MST trading paradigm – by working to simplify – by not over-optimizing – using a standard overlay for all markets/assets traded…..but time will test my luck.
