Position Update

Current holdings:

  1. Short March Silver (SI H6)
  2. Long March DAX
  3. Short March Coffee (KC H6)
  4. Short March Wheat (ZW H6)
  5. Long Jan Lumber (LB F6)

MST (Momentum Swing Trading) Program seasonal strength markets:

1.Gold/Silver (Long or Short signal traded) – November-January

2.DAX 30 (Long or Short signals traded ) – January

3.Wheat (Long or Short signal traded) – November – January

Year-round markets traded:

1.Swiss Franc Futures
2.Lumber Futures

3.Coffee Futures.

Today, following FOMC, the program went Short March Silver, Long DAX30.

I will update a revised year-end performance 2015 soon.

Buy Alert: Lumber (LBS N4 (July))

Long entry at 249.50 in the July Lumber futures 13/5, offsetting previous short position for 25.9$ of profit/contract = 2,849/contract.  Risk sits below the pivot low price at 225. Its starting to feel like commodities are catching a bid, with Oil creeping higher, same for Nat Gas, Grain complex has been the weak link, but it feels as though it may be wanting push higher as well. the Meat complex has been strong, with a huge move in the Lean Hogs futures. Soft commodities have been lead in strength by Cocoa, Cotton is looking supportive here, as is Coffee….and now Lumber? With the Equities well bid, it looks reflationary across the board.

Page1620150514203034

Roll Lumber: LBS K5 to LBS N5 (May to July) + Are We Nearing a Price Bottom?

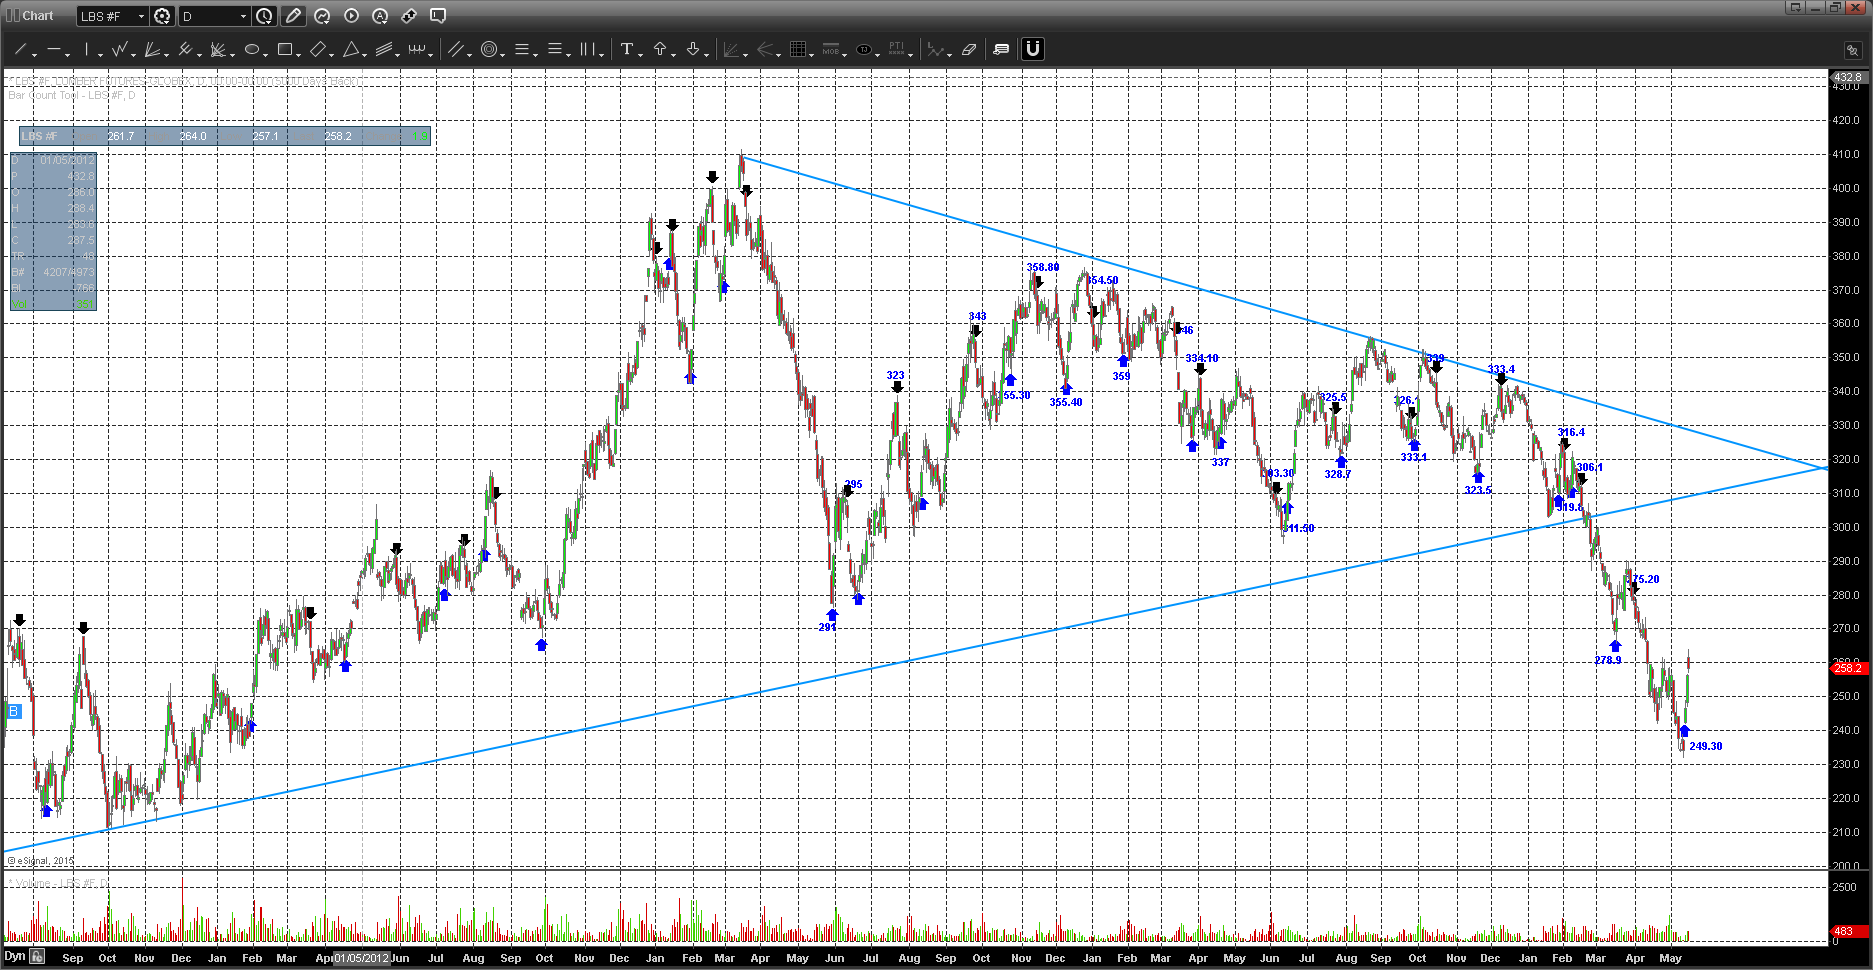
Short Entry in Lumber came 3/31/15 at 275.20. Lumber continues to be a weak-link in the ‘soft’ space, as per the major breakdown at the 272 level — representing quarterly structural lows, defined as a supportive level in this continuous contract since May 13′ pivot low. This market is currently trading in line with Jan 12′ levels. I’ve attached the weekly chart of Lumber below; I’ve included the weekly MACD in the lower panel, which addresses the over-sold nature of this market, given the momentum weakness to the 1st standard deviation, as per the ‘white’ horizontal line overlaying MACD data (< -21). This depressed, oversold level in momentum has only occurred 7 times since 93′: 3 of 6 (excluding this latest MACD read) reads on the ‘slow’ MACD have produced 50-100% rallies over the ensuing 6-12 months, whereas the other 50% of occurrences resulted in a further 3-12 months of perpetual weakness/basing, followed by 75-100% moves thereafter. If I were a long term investor looking at Commodities, Lumber is an example of having strong odds of being much higher in 12-18 months from now. The other possibility that we should be open too, is the fact that Lumber may be sending an ominous message to the equity/housing space, as per its deflationary action. This can be gleaned by the fact that Lumber lead the housing market by 2yrs (2006) and the broad equity market by 3 yrs (2007), when it made its final high in Aug 2004. By July of 2007, Lumber had already declined by -33% (460 in Aug 2004 to 306 in July 2006), prior to its final low inline with the broader market in Feb 2009 at 140. To date, Lumber has declined from the 410 level in Mar 2013 (410-243 = -40%) over 2 years. There have been 4 bear markets in Lumber since 93′: 3 occurrences with duration of 2 yrs (93′-95′, 96′-98, 99′-01′) and 1 duration of ~5yrs (04′-09′). From a timing perspective, Lumber is in the zone of putting in a final low, making this price level a good long term buying opportunity, or we have some further downside. I’m not a discretionary market-timer, and I just try to read the bread crumbs — and stick to system trades.

Continue reading “Roll Lumber: LBS K5 to LBS N5 (May to July) + Are We Nearing a Price Bottom?”

Buy Alert: French Government Bonds (OAT M5)

There appears to be reasonable odds of a short term price bottom in the Euro-Bond space (Long end). Using the systems primary trading vehicle, the French 30yr Government Bond (OAT), today’s session put in a ‘failure condition’, reconfirming the Long Signal entry May 8/15 off the long tailed low inflection point. The failure condition is a false +ve of a short signal that was reversed by the close of the trading day. This occurred today, as global debt markets came under overnight selling pressure, carrying into the open of the US markets. This weakness produced a Short Entry condition in the FOAT. This was reversed, however, as the OAT M5 rallied back (along with the FI space globally) and closed in a position where the momentum filter recognized the statistical nature of the activity as ‘meaningful’, relative to the short term proprietary structure that is used to benchmark and filter price activity intraday. When the French 30yr generates a ‘failed condition’ (a statistical re-affirmation of the prevailing signal, in this case long) there is a 100% win rate over 3 years of data. To boot, French Long Bonds trade summary in the program is as follows (1 lot, ex-slippage, commission)

Trading Period: 3yrs (Start Date: Feb 2012)

Total Signals: 46

Win Rate: 41.3%

Avg $ Win/Trade: $2456

Avg $ Loss/Trade: -$994

$Win/$Loss: 2.47x

Largest $Win: 11,390

Largest $Loss: -$4660

Continue reading “Buy Alert: French Government Bonds (OAT M5)”

March Trading Summary

The month of March generated $24,562 in trading profit on 1 contract/market for all signals generated by the program:

Total Signals in March:  19

Wins/Losses: 7/12

Win %: 36.84%

Avg $ Win: 5,917

Avg $ Loss: -1390

Avg $ Win/Avg $ Loss: 4.25x

Largest $ Win: 17,287

Largest $ Loss: -3175

Monthly Drawdown: -7875

You can see a breakdown of all trades posted in the ‘Portfolio’ tab.

I will re-emphasize how important it is to HOLD all winning trades until the extent of the move (reversal), to ensure long term profitability as a short-intermediate term trend trader: March monthly Win Rate = 36% only. So, I’m winning 1 in 3 trades, but check out the Win/Loss ratio = 4.25x. For every dollar lost (risked), I won $4.25 back. That is why I take all signals, because it is a challenging endeavor to know with certainty which signals will manifest as asymmetric winners — I have no way of really knowing which signal is going to move big — so I take all of them. These are the type of stats, where reproducible have the makings to pull out lots of profit from the markets. A system that keeps you in a winning trade and gets right out of losers — that the secret, moreso than win rate.

Short Alert: Nikkei Stock Index Futures (NKD M5)

Equities are looking vulnerable as they push along at all time highs, across the board. The Nikkei Futures (NKD M5) delivered a short entry pre-FOMC 4/29 (yesterday). There was no spark-infusion to the equity space post-FOMC, so I entered the order at 19,800. See the chart attached below. All short signals across the equity space have been getting smoked over the course of the more recent (2-3 months) uptrend. I’m watching the DAX closely, as the leading international market, and its looking toppy here. On 4/27, the DAX triggered a nice long entry signal in the program, but the risk/reward was about even on the trade at the 12,000 level as per the front month futures. I waited on it. 4/28, the DAX reversed completely inline with a fast break across the German Gov Fixed Income space across the curve (BUXL, BUND, BOBL) all got hammered. My thought process with the equities is to look for weakness in the Euro-space/German markets, and leverage that weakness in the Nikkei 225 futures on short signals, which I’ve captured yesterday. Let’s see how this unfolds. My rule of thumb with trending market conditions (this has a specific, quantifiable definition) is to only trade in the direction of the trend, using my system, unless seasonal cycles and/or extent and duration of trend (#days/months in context with historical) all converge to support a countertrend exposure. Otherwise, its more favorable to either take some profit, or add to winners in trending environments on countertrend signals. Its also important to hone your market ‘sense’ or instincts and to develop yourself to know how to read the inter-market relations to selectively risk capital in countertrend context. I’ve stated my justification for a short Nikkei position here — using weakness in the DAX as a proxy for international markets, and stocks in general at this point.

Continue reading “Short Alert: Nikkei Stock Index Futures (NKD M5)”

Short Alert: Feeder Cattle (GF K5) — Using Seasonal Cycles and Automated Signals

Feeder Cattle went short in the April (J5) contract at 2.1342. I sold the May futures, given April goes off the board next week. When a commodity is demonstrating a behavior consistent  with either a seasonal or contra-seasonal cyclical pattern, any (statistically proven) trend system can be used to time the seasonal inflections to enhance alpha generation. All markets are inherently cyclical; the periodicity of inflection ‘months’ (associated with seasonal cycles) act as a discretionary indicator, whereby program signals can be ‘scored’ or valued based on their monthly occurrence – inline with the seasonals.  In the case of Feeder Cattle, the market is trading seasonally in 15′ – trending higher into the Spring — lower into the summer — higher into the fall (to be expected). When we develop that seasonal insight, use a reliable trading tool to time the entry/exit algo coordinating with anticipated monthly reversals. I watched Feeder Cattle struggle at the 2.20$ level, then pivot and generate a sell signal. Although trade location is not ideal, I’m leaning on the seasonal to pressure the market into summer lows. If my system generates a fresh long between now and Aug, there would be 2 ways to approach this: Take the long entry if the exposure warrants an acceptable amount of risk and at fractional unit sizing or do not buy the market unless the signals presents closer to the seasonal timing (Buy a long entry in late July/Aug). Quarterly support on the continuous contract (attached) (green dashed line) stands at 2.0765, with Monthly time frame of support at 2.0025 (brown line).  The downside looks reasonably contained here, structurally in the May contract.

Page1120150421140933

Closer Look at the Dollar Index ($DX_F)

The US Dollar Index has been traversing a volatile range since the FOMC meeting March 18/15, which produced an intermediate term sell signal from my momentum program (see recent black down arrow referencing 98.715). $DX_F produced a wide-range liquidation bar (100-94.76) of ~6 points — the high/low prices referenced are the important short-intermediate term pivots to watch. The longer it takes for DX_F to challenge the par level (100), the more probable it will be that we can expect a retrace to the reference low price sub 95 level on the chart. The other possibility is that we see a rapid retest to the 100 level in the near term. If this happens we have to wait and see whether price moves above 100 and gets accepted (2-3 days or a weekly close), or whether it goes >100 and gets rejected back into the 100-95 bar range established on 3/18/15, which would validate ongoing corrective odds in this market.  And the same logic holds true for the 94.75 reference low. However, it is quite possible that the ‘late’ longs got wiped out and we’re seeing a short term pause, prior to another move higher, given the chronic weakness of the Eurocurrency. If I was trading the DX_F, I would be patient here, see if the market returns to the 95 level and holds, for a supportive re-entry. My system generated a short entry on 3/18 at 98 level, and that is my position to date. The system has performed well in $DX_F: 1 contract traded, ex-slippage/comission

3yr back test: (2012-2015)

Total Signals: 16

Win Rate:62.5%

Avg $ Winning Trade: 2424$

Avg $ Losing Trade: 730$

$Win:$Loss = 3.32

Largest Win$: 9355

Largest Loss$: 1735

Continue reading “Closer Look at the Dollar Index ($DX_F)”