

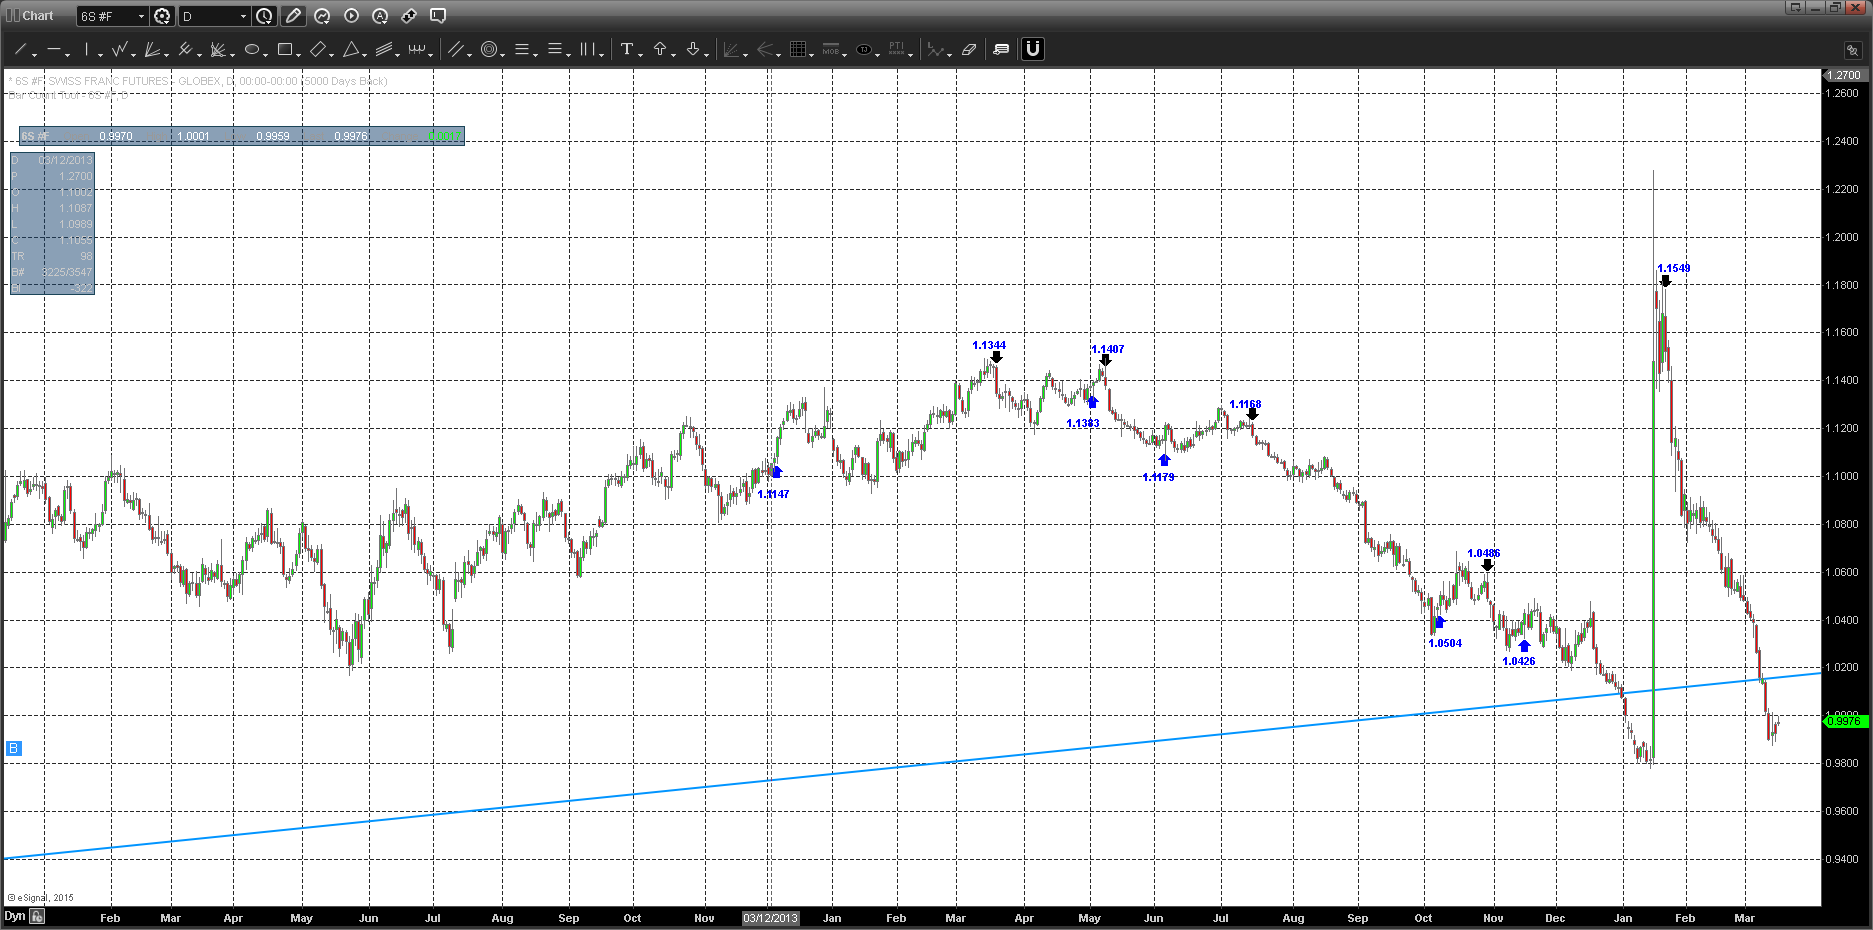
The system generated a buy alert for CHF (6S Globex) on 3/18, FOMC day at 1.0166, and the trade is running away to the upside. The Swiss Franc retraced the entire bar that took the overnight market from .97 to 1.22 level. The program picked off a huge winner on the retrace from 1.1549 – 1.0166 ($17,287.5/contract profit). This was 3x avg historical win rate. We could easily see a fast move to 1.0688 Quarterly High level (Green dashed line) and above that there is space on the chart for a bigger move. More importantly, this trade reflects an intermediate pivot in the Dollar Index (DX). I could see the Swiss move to 1.07 in line with a down move in the Dollar Index to the 95 level. From there, the question is whether we see a hard, fast correction in the Dollar, with a subsequent recovery, or whether this latest signal (CHF + DX) is the early stages of a more protracted Dollar correction, reflationary signal to the commodity space, as per the breadth of money flow into commodities since latest FOMC.
Author: futures trader
Buy Alert: Cotton (CT K5)
On 3/18 (FOMC day), we saw a wave of reflation across the commodity, index, bond space. Cotton delivered a Buy Alert on that day, offsetting previous Short trade at the .6387 level for a $1400/contract profit. Cotton has been a great performer over the past 12 months and historically. You can find more data on the CT market on the ‘Backtest’ page. I’m now long CT K5 at .6107 with a stop at .57. Cotton remains in a Weekly momentum uptrend, which is a secondary, discretionary overlay I use to position size; I am generally more aggressive when the system lines up with the Weekly MACD differential, which is currently +ve and trending higher (and the buy signal) — this generates a higher probability win rate over an 8 year sample. Cotton has spent some time down in the Sub .60c level and looks to be building support. The Quaterly/Monthly resistance is lining up just below .66c level and this will be tough to beat. And given the weak chart, I’ve been taking all sell signals aggressively short, because its a low risk trade, as the chart sets up. The flip side, as I’ve mentioned, is that cotton is looking increasingly supportive down here. Thats not to say the market is going to runaway > .66c. We are likely to see some decent sideways action develop in 15′. And this will be supportive to the program trades as we have a respectable .10c range to trade within (.66 – .57). It could get choppy if that range starts to tighten up. In other words, I’m a seller of CT at .66 with the system short signals and a buyer and a buyer of CT at .60 level for now. Putting on trades too far away from these levels will increase risk. In sideways markets we need optimal trade location until the market proves us wrong and breaks away.
Roll Feeder Cattle: From GF H5 to GF J5 (March to April)
The system got in real good on the GF March contract at 2.06 level as per the blue arrow on the day chart copied below. If Feeder Cattle closes > 2.20 level, I could envision the April contract moving to the 228.5 Monthly Resistance (Brown dashed line), in line with the ‘down trend line’ (blue line), converging into 2.30 level come April. The Strongest resistance is the Quarterly 2.36175 level (Green dashed line). Now, that all looks good, but 2.20 could be a tough area on the chart as it served as monthly support under the market from Oct/14 – Jan/14, so it should now serve as a more imbedded resistance level. The Live Cattle market also looks good and so we should look for potential weakness from the Live Cattle futures as an ominous sign for the Fed market.
Continue reading “Roll Feeder Cattle: From GF H5 to GF J5 (March to April)”
Buy Alert: Lumber (LB K5) and On Market Structure
Long signal came in last night in the Lumber market. I do filter O/N market price data in the Lumber market. I noticed the Lumber market was generally ‘quiet’ during the pit session, but would become increasingly active prior to the electronic market close (15:00-17:00), typically with directional follow through into the o/n open at 18:00. So I began tinkering with the momentum data filter and a very different Lumber program emerged. Performance metrics for Lumber, historically are most ‘consistent’ of any market I trade — as the frequency of signals increased, win rate would increase proportionately, which is unusual. Most importantly, Lumber has never drawn down over $53 (x110 /contract = $5830) in a particular consecutive losing streak or on a individual trade over 8 yrs. With the average risk/trade at $10 (x110/contract = $1110), with the average Win:Loss ratio at 2.10x (Win/contract = 2.10x Loss). So this market emerged as a steady long term performing market in the tool kit. Having said all that, you can never implicitly ‘trust’ a market, but the track record is something adds a dynamic of confidence. Unfortunately, market depth has dried up over the years, making it difficult to visualize a real scalable business model in the Lumber market, as average daily volumes have significantly changed, threatening risk due to slippage.
Continue reading “Buy Alert: Lumber (LB K5) and On Market Structure”
Short Alert: May Corn (ZC K5)
The system sold corn today, reversing a long position at the previous long entry (blue arrow) 3.82 as per the continuous contract day chart below. Today’s short entry is now aligned with the weekly MACD momentum differential, which re-initiated its negative cross-over dynamic back in the first week of March 15′, with accelerating bearish momentum over the past 2 weeks. Across the board grain charts are looking weak, feeling heavy. Wheat didn’t confirm the latest round of buy signals in Corn and Beans, its been Bearish in the system since Dec 12/14. So there has been intra-grain market divergences with respect to the system indicator. To boot, the system went Long the Livestock space, specifically, my preferred vehicle, Feeder Cattle, Mar 4/15 at the 2.06 level in March contract. The implied indirect correlation with Grains and Feeder Cattle seems to be re-establishing its bias (indirectly) with Long GF, Short ZC positioning. I’ve shown the 8 year performance in Corn below:
Corn SignalPerformance: 1 Contract ex-commission, slippage
Start-End: April 2007 – Dec 2014
Signals: 94
% Win: 41
Avg $Trade:509
Avg $Win/Avg$ Loss: 2701/1045 (2.59x)
Largest $Win: 10,675
Largest $Loss:-2662
Avg Holding: 20.4 days
Roll Swiss Franc (CHF H5 to CHF M5)
The system generated a Short Entry in the Swiss Franc (Mar) futures back on Jan 22/15 at the 1.1549 level, following SNB overnight decisions Jan 15/15 to de-link the Swiss Franc from the Euro Currency. This Short Entry has produced substantial profit from the 1.15 level, which has seen the market retrace the entire overnight move that took the Swiss Franc from below par to the USD to touch 1.22c level. The system re-captured the entire down-swing of .15c. Looking to see the Swiss find some support sub 1.00. I see this market being a strong performer for the Momentum Swing Program in 2015.
Buy Alert: Nikkei Stock Index (NKD M5)
I got caught out on the Nikkei Short Signal, and was subsequently stopped early today. This afternoon has produced a Buy Signal. The trend is up across the equity space. Money is flowing into the DAX, which leads all major international equity indices. The Nikkei has been a strong performer as per the chart below and latest ‘blue’ up arrow buy signal. My stop sits below the latest pull back at the 18,400 level. I could see 19,500 on the Nikkei in the short term.

Short Alert NKD M5 — Just Stopped Out
The system picked up a big swing to the upside in the Nikkei 225 Index futures; as per the chart below, last Long entry (1/16/15) at 17,050 produced big profit of 1,495 pts/contract = 7,475$/contract (17,050 – 18545). This last win is 3x Avg Win over 6 years. The exit and reverse to the short side on 3/10/15 (18545) came and went. I was stopped out this morning for a -455 pt/contract loss = -2,275/contract. Which is why you need a system that generate large Win:Loss over long time frame samples so that if the system experiences short-intermediate term draw down, you are buffered by the ‘tail’ event wins.
Here’s the stat breakdown for Nikkei 225 Stock Index Futures: 1 Contract traded (ex slippage/commission)
Duration: 5 years, 11 months (3/23/09) Start
Signals: 156
Win %: 40.4
Avg $ Win: Avg $ Loss = 2.39x (2489$/-1045$) = +497.5 pts/win, -209 pts/loss
Largest Win$: 13,650
Largest Loss: -3450$
Net Profit: 61,225
Total Return on Initial Capital (10,000$): 612.2%
Roll Lumber (LBS H5 to LBS K5)
The system has had a nice run in the recent move down in Lumber. The Short Entry on 2/18/15 at 306.1 in the March contract has worked well, as per the last ‘black’ down-arrow on the day chart below…the market is approaching the strong Quarterly support at 272. Continue reading “Roll Lumber (LBS H5 to LBS K5)”
Buy Alert: Orange Juice (OJ K5) and On System Metrics
This offsets last post on OJ. The system has reversed that trade with a Long entry in the May contract (K5) at 1.1985 on 3/9/15. See the last ‘blue’ arrow on the screenshot below. Last Short Entry posts up a loss of $465/contract
Continue reading “Buy Alert: Orange Juice (OJ K5) and On System Metrics”
