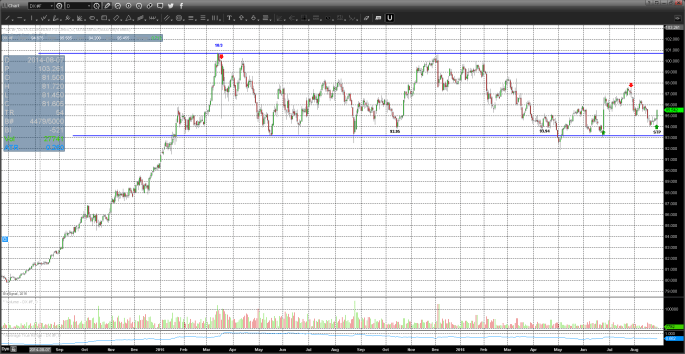

The day chart below shows all signals generated YTD in the Lumber (LBS #F) market; including the most recent long signal generated 9/19. This latest long trade is in the money – as LBS closed at a new weekly highs for 2016 at the end of last week. 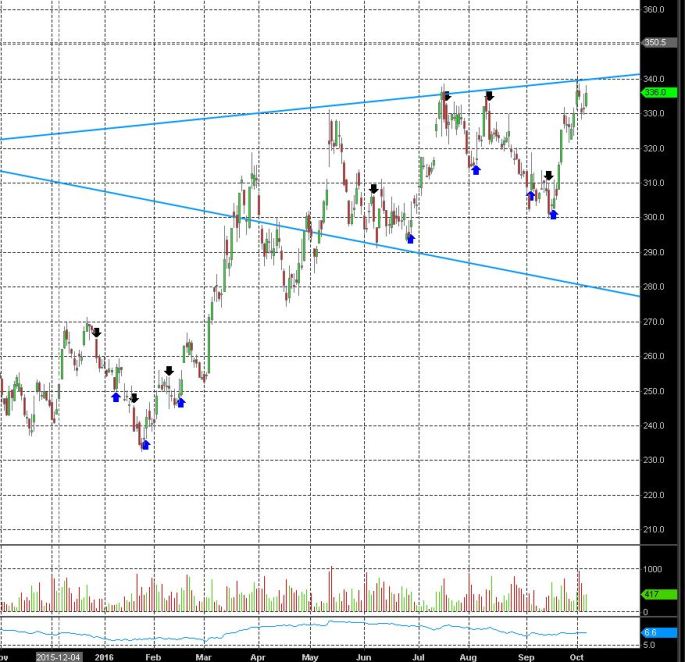
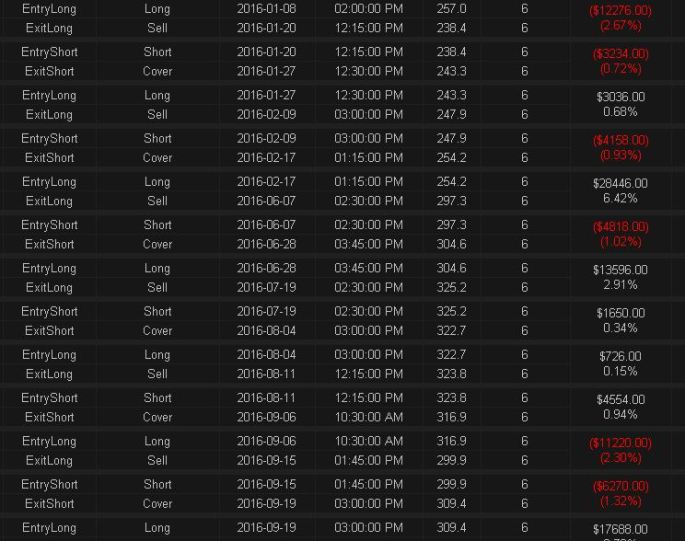
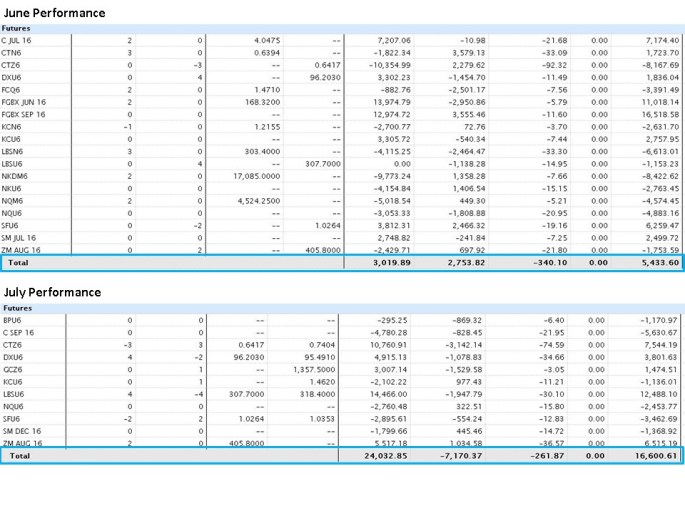
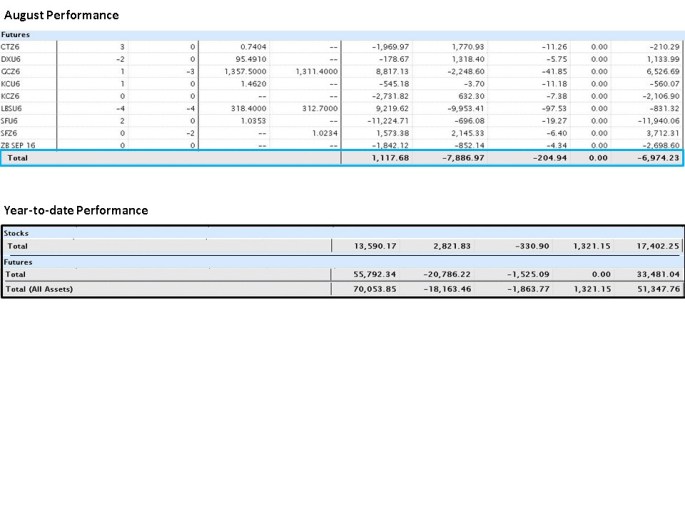
I am showing all signal outcomes in 2016 (long and short) in 6 lot position sizing:
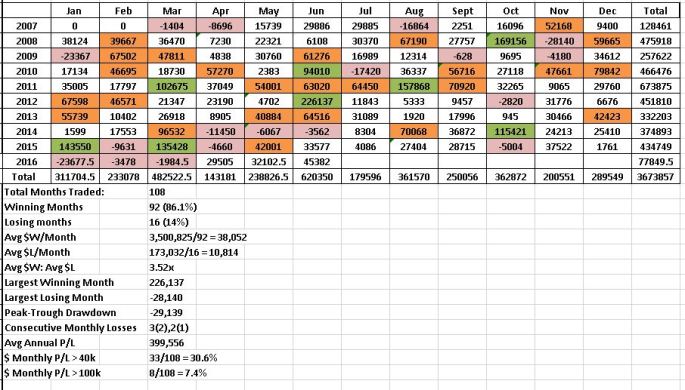
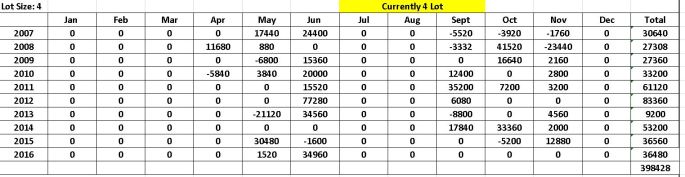
Along with annual trading P/L since 2009 (6 lots):

The Lumber ‘program’ has generated mean profits of ~90,000/yr, trading 6 lots since 2009. The 2016 trading year is generating wins (57% profitable trades), however, the payout is tighter this year as per the smaller net profit (~27,000). In systematic trading, you never really know when the equity curve is set to trade higher, and so the discipline is in staying with historically high % winning programs (or assets). In other words, the trader can generate expectation based on historical payout ratio’s (avg $ win/loss, % win rate) but the returns will deviate around these median values. I look at the chart reflecting 2016 trades in Lumber and the profits were contributed by 4 of the 14 signals (3 long, 1 short) — if the trader ‘felt’ discouraged by the results (say at some earlier point in the yr), and decided not to participate in a ‘trade or two’ to ‘see’ how the market would develop, you probably would have missed the ride on some of these larger winners, eroding performance metrics consistent with the asset and the portfolio at large. My rule in systems trading is to stay with the high performing markets through draw-downs.
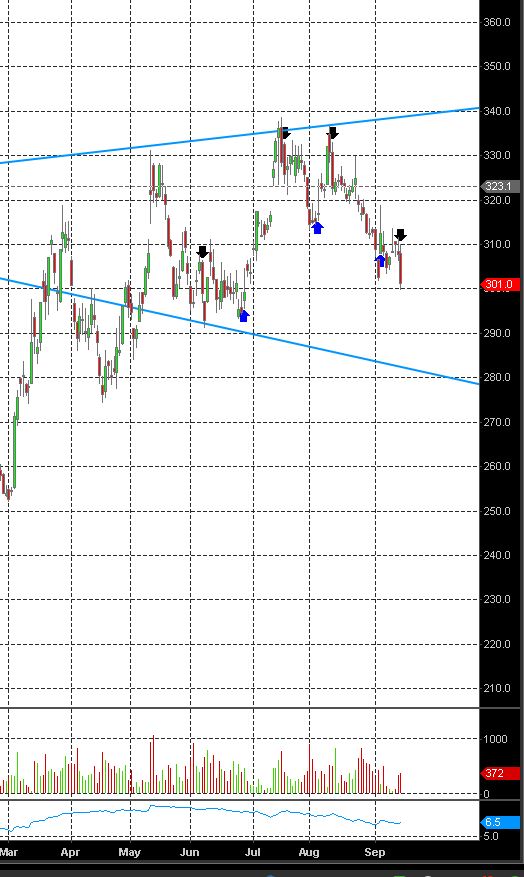
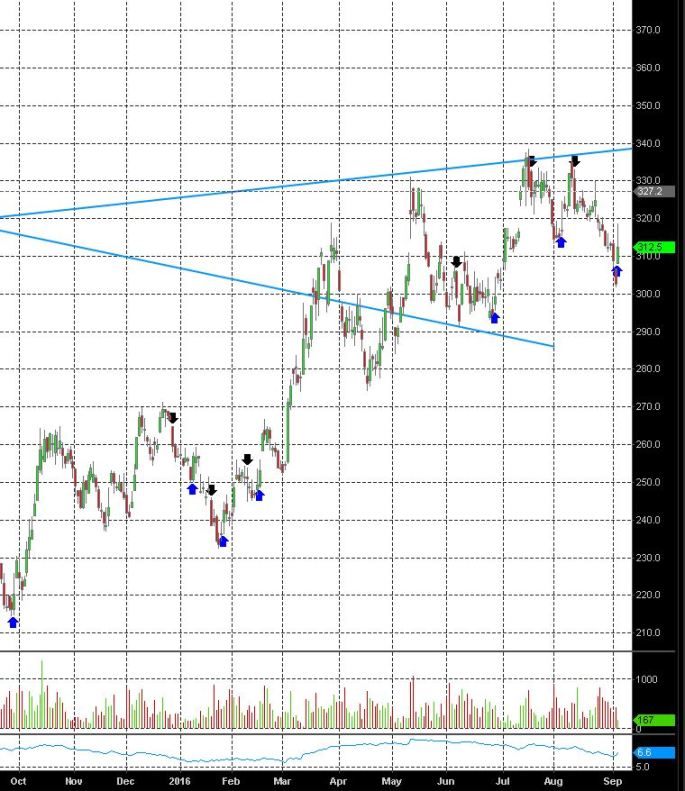 LBS has a 60% 10 yr win rate, which is an ‘extra-ordinary’ win rate. This market is a year-round trading vehicle, ~10 trades/yr. Payout ratio = 2.20x. The market has suffered 1 annual loss – in 2014 of -$5000, trading 4-5 lots. This is a ‘controlled’ market in response to the MST program and a stalwart market. I like the trade location here as per the most recent blue up arrow. Anything below the most recent pivot on the chart at ~300 is the stop. The trend in Lumber is still up in 2016 – and given the moves across most of the commodity space, specifically softs – I like the R/R on the trade here.
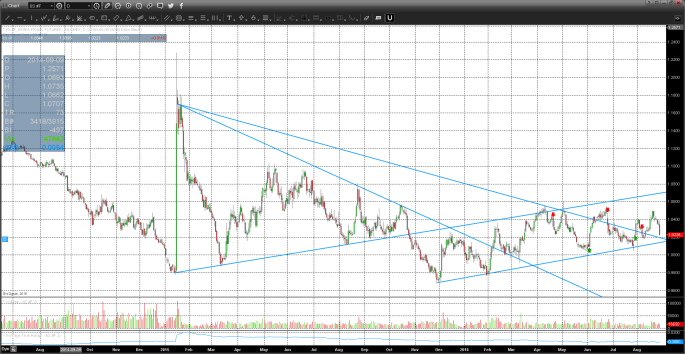
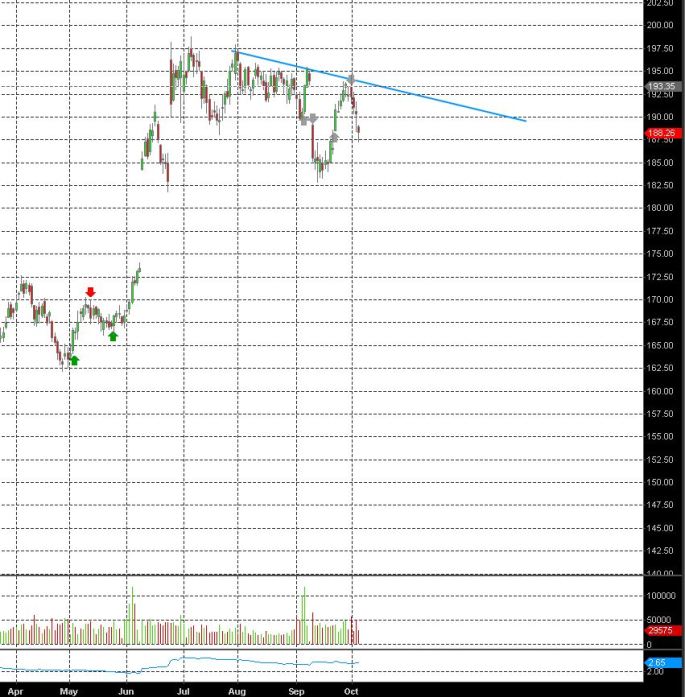
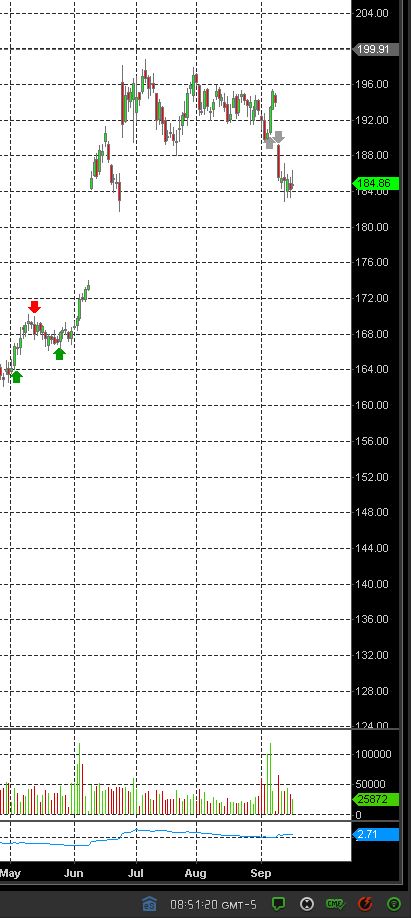
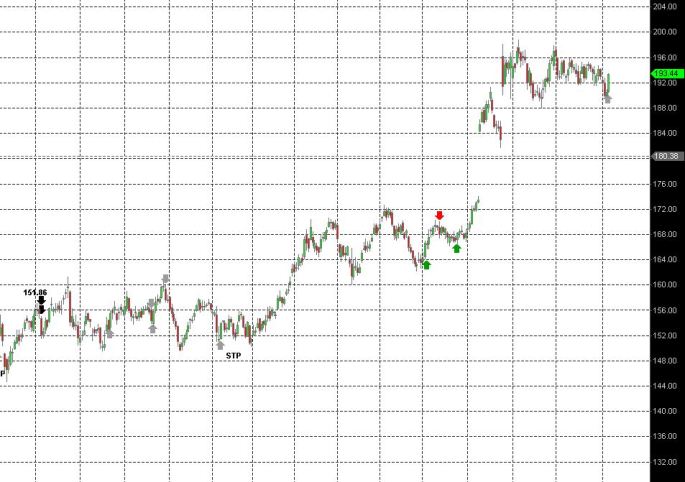 with the most recent grey arrow indicating the signal. There appears to be a ‘double bottom’ at the 188 level – so anything below this on a daily closing basis would suggest I am on the wrong side. Overall, there’s ~4pts of risk = $4000/contract – and this looks to me like a bracketing set up with the upside at 196-198. There’s a lot of ‘technical’ space on the chart below 181 level, but the chart is moving to the upper right side, despite the ‘lofty’ feel of the FI space YTD.
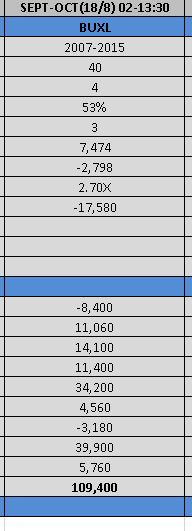
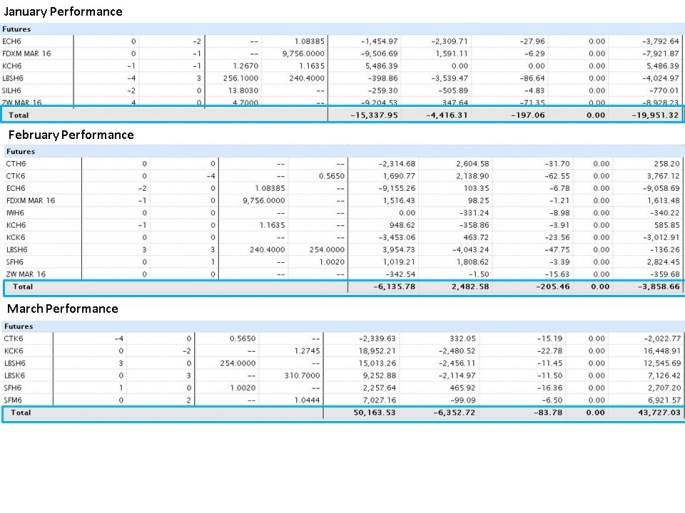
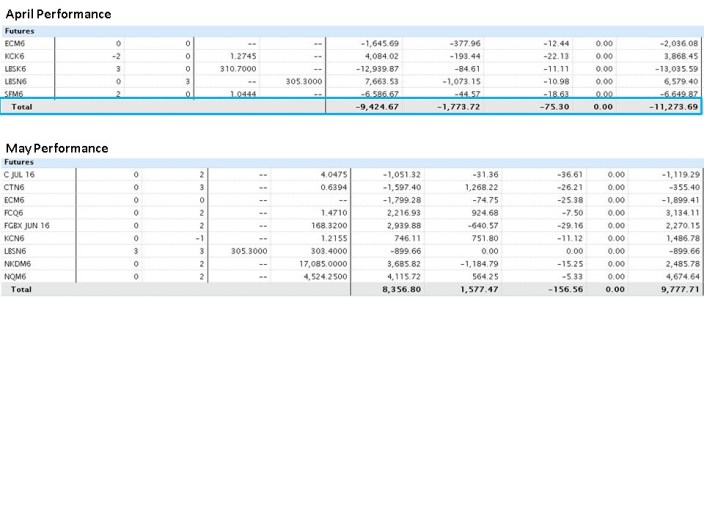
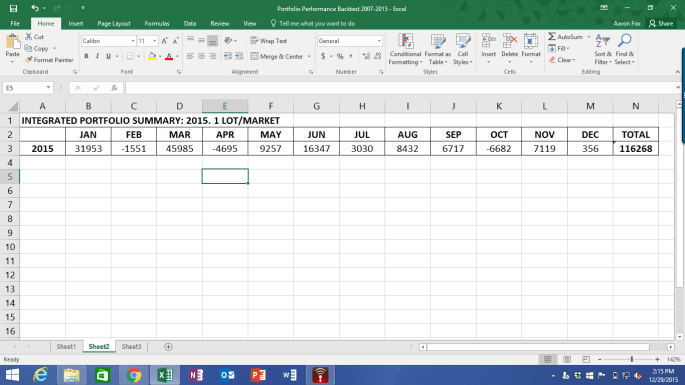
 I am including a table below that displays trading results from previous years using my own leverage model: