

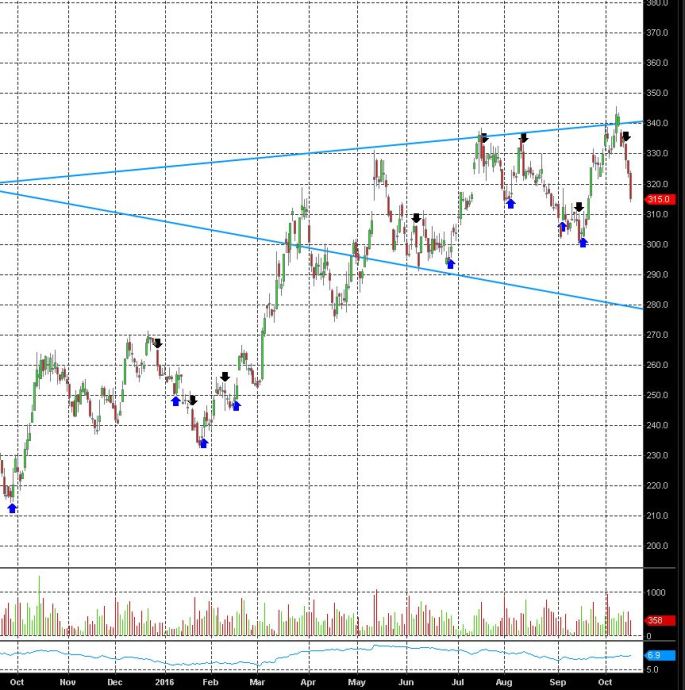
The Lumber trade went short Oct 13, as per the day chart – recent ‘black’ down arrow – indicating the trade entry. Prior to putting on a system-trades, I evaluate whether a given signal has the propensity to asymmetrically perform – ie., did the signal anticipate a big market move.
In evaluating the Lumber market in a previous post, I suggested that 4/14 trades produced the P/L in 2016. So then, what can system traders look for as clues to support say putting on larger size to capture these events with more certainty. Of course there are many indicators that can be applied to filter asymmetric winners. It may plainly be an intuitive response, or derived from fundamentals.
For this particular trade, I am going to look at the weekly momentum MACD to gain some additional information about what may be occurring in the Lumber market, as it relates to the timing of the current short trade.
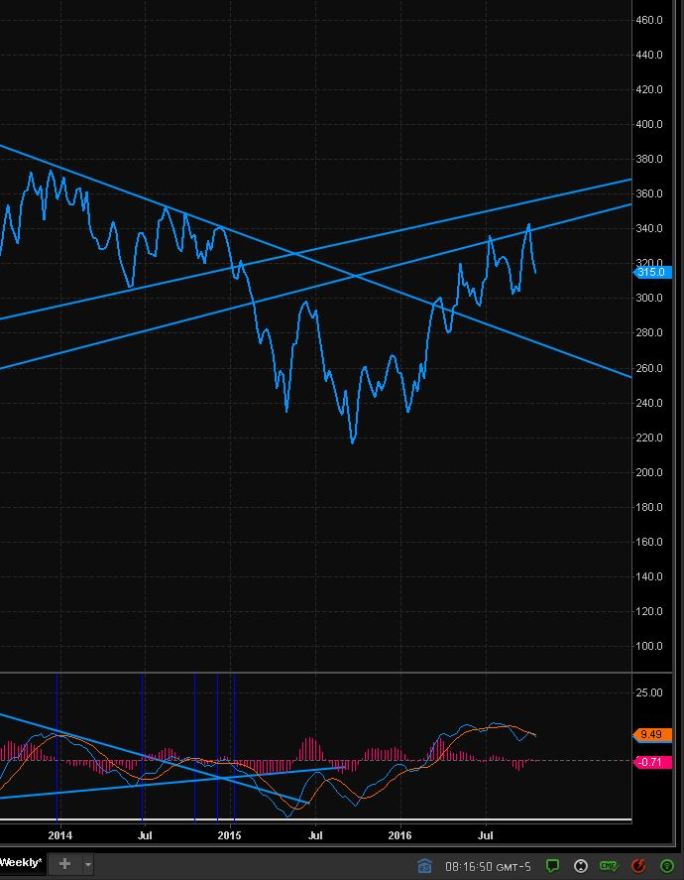
The line-chart (above) from the weekly time-frame has produced higher highs (in price), against a long term up trend line. The lower panel shows momentum divergence from the latest price-high as the ‘slow’ MACD indicator has turned down, not confirming the recent high in price. The fast MACD crossed over and began trending below the slower MACD from the last decline in price associated with the previous high. This latest high in price had the fast oscillator move back into the slow oscillator, before turning down again. These are strong longer term momentum setups. The Lumber market may be producing a longer term top here.
As it relates to taking system trades, the weekly chart is supportive to the current short position, as the market has been moving higher in price without confirmation. When system signals are ‘sensitive’ to short term changes, watch the longer time-frames to gain insight into your trade confirmation.
