

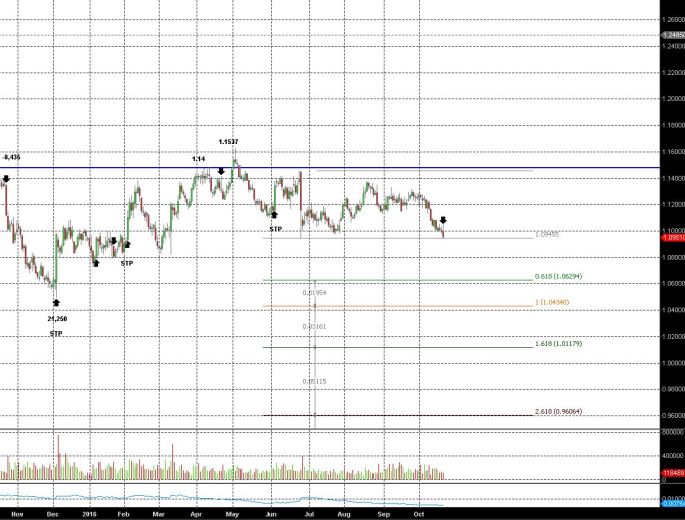
MST generated a short signal in the Eurocurrency this morning as well. I’m not thrilled about the trade location on this, but I like the Dollar Index chart from the long side, with what appears to be a technical breakout and closing high today > 98 level, suggesting a re-test of par. This would imply continued short-intermediate term weakness – at least until the next FOMC meeting – but I doubt any policy changes are set to take place before the election.
This signal gets triggered right at the support level of the the BREXIT bar (event driven bar), which has basically contained all the price action. The chart looks weak in my view, and the weekly chart is also seeing MACD crossover and breakdown. What would be supportive from the short side near term is a weekly closing < 1.09, which is the previous weekly closing pivot low – if the USD Index closes up the week on a strong note tomorrow, then going into next week, we could expect continuation lower in the EUR. Purely, from a technical Fib Extension overlay perspective, we could see the Eur move towards previous lows at 1.04 level. The chart has been bracketing between 1.14 – 1.04 since Mar 2015 — and so it looks as though if the Eur can close on weekly basis below the BREXIT lows – an important technical candle day – then 1.04 is back on the table as the next stop.
I am showing the Eurocurrency historical performance since 2007 below:
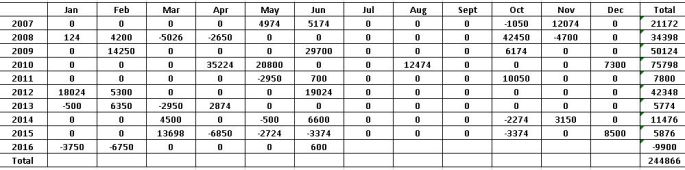
The Eurocurrency is ‘active’ in the portfolio during the months of March, May, August and October, and has generated the following data:
Total Signals: 45
Win Rate: 69%
Payout: 2.73x
Avg $ Win (1 lot): 5028
Avg $ Loss (1 lot): -1840
Avg $ P/L/Annum: +14,153
The Eurocurrency program has not had a losing year since inception
