
MST program has experienced several signals into the new trading year.
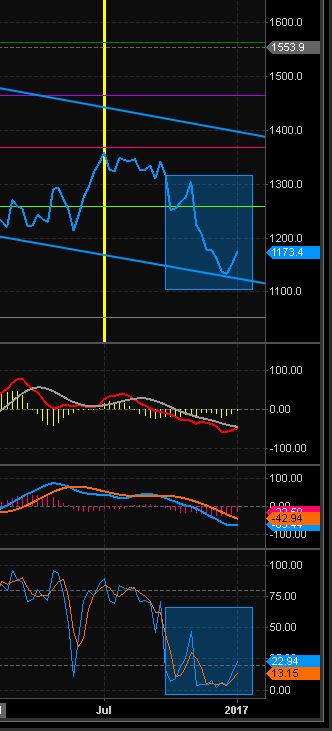
Current open positions: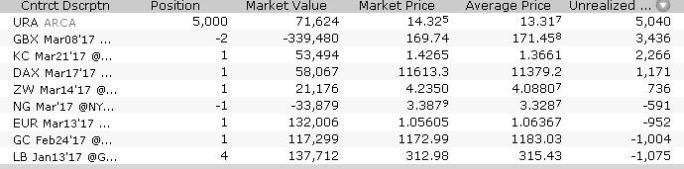
To overview recent futures signals below:
1.Long Feb Gold:
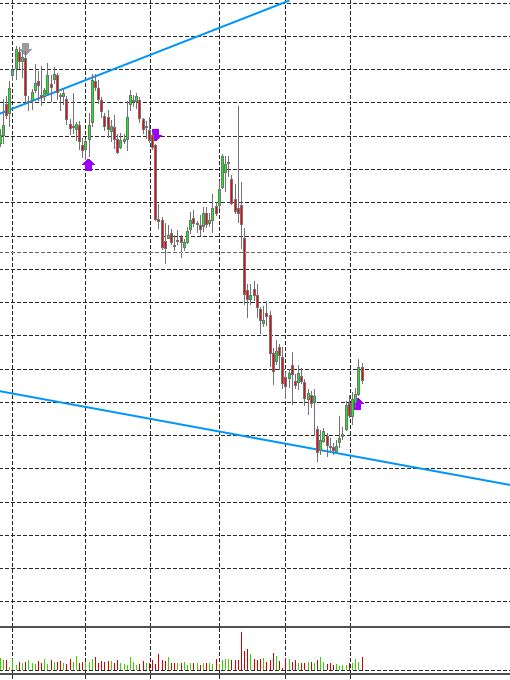
This long signal was entered for the Jan ‘seasonal’ trading as per MST monthly trading schedule and as per the recent ‘purple up arrow’ shown in the day chart above. Gold is taking a bounce off the long term down downtrend line dating back to the market top in Dec 2011. The gold phase-shifted above this resistance in early 2016 and is now trading using this as a technical support level. I’m not thrilled about the trade location off this recent bounce, but I’m in the market with small exposure for now. I still like this long position for now as the market may need to unwind the oversold condition as per the weekly stochastic below:
The weekly stochastic indicator boxed out above and corresponding to the weekly line chart in the continuous gold futures is suggesting the market should mean revert short-intermediate term. The weekly stochastic has remained depressed below the ’20’ level implying a very oversold condition since August 2016. And this is the most prolonged oversold weekly stochastic condition since the 2011 downtrend in gold began.
2.Long March Euro-currency Futures:
In line with the contrarian trade, I am long the Euro-currency for the first time since Sep 2016:
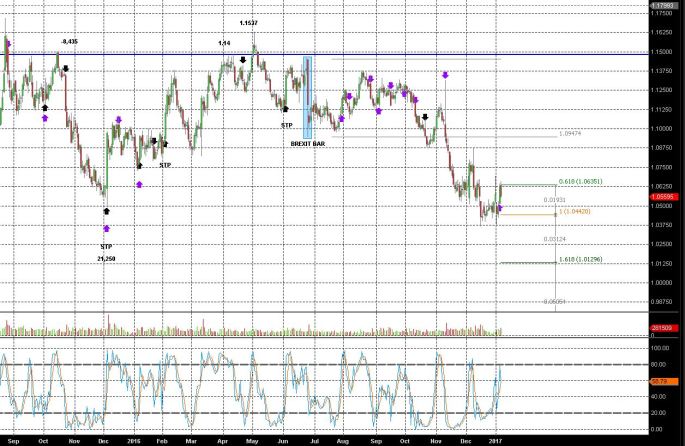
From the day chart above, the Euro continuous futures has been in a long-term bracketing pattern since the March 2015 low at the 1.05 level. I wrote on this market last in Oct, when the BREXIT bar low was threatening to breakdown on Nov 9th, suggesting the Euro could revert back to the 1.05 level. The Fib-Extension overlay above helped to generate trade expectation as the market broke the BREXIT bar low, on a expansion bar, indicated by the most recent ‘purple down arrow’. This trade was recently booked and reversed with a long entry as per the most recent ‘purple up arrow’ yesterday. The breakout in the Euro corresponded to the recent breakdown in the USD Index, which due for a pull-back.
3. Short March BUXL Futures (German Long bond Futures):
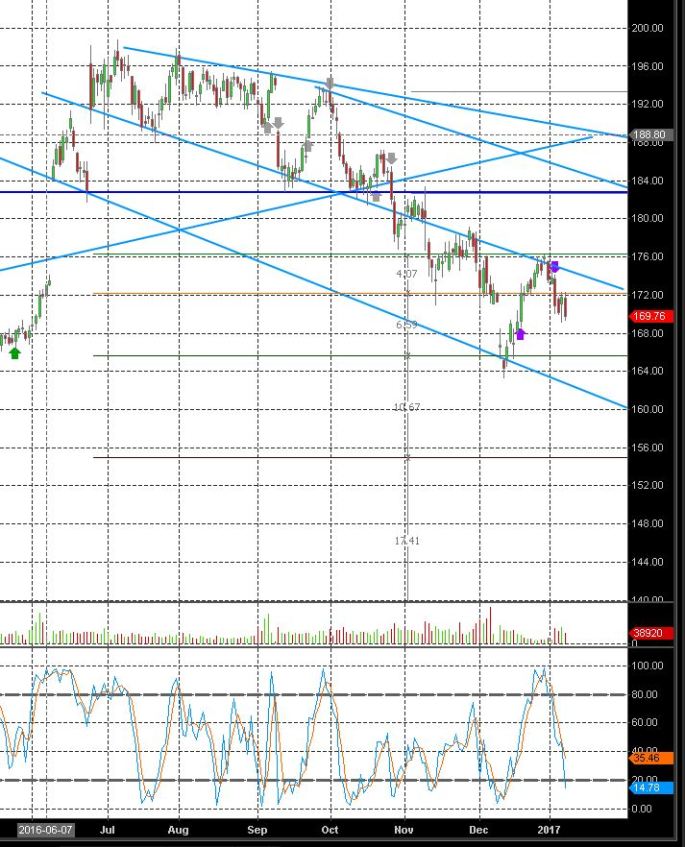
I have renewed my short position in the BUXL futures as per the day chart below:
I bought the most recent bounce off the long extended down-trend line, reflected by the recent purple up-arrow, which was a flat trade, as the BUXL reversed to the downside (most recent purple down arrow). This market is getting progressively weaker as can be visualized by the reversion to the first down-trend line in late Nov and now again in late Dec/early Jan, and unable to phase shift back higher and instead the market moves back lower, threatening to revert to previous support at the 164 level.
I still think it is likely we may see a mean reversion in the FI space (back to the upside) and this market may be in the process of forming a base/double bottom at this level and could head higher.
In the Commodity space MST is Short Nat Gas March Futures, Long Jan Lumber, Long March Coffee: I have copied charts below with recent arrows noting current trades.
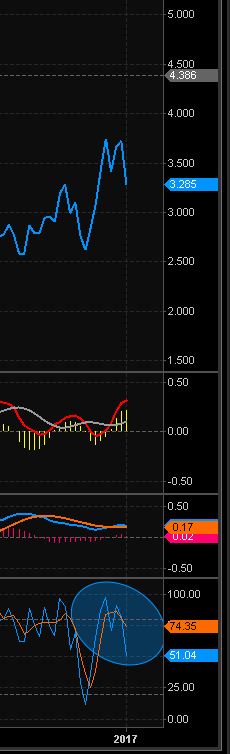
4.Short March Nat Gas:
We have the breakdown in the weekly Stochastic in NG as per the weekly line chart below suggesting possible continued short term weakness.
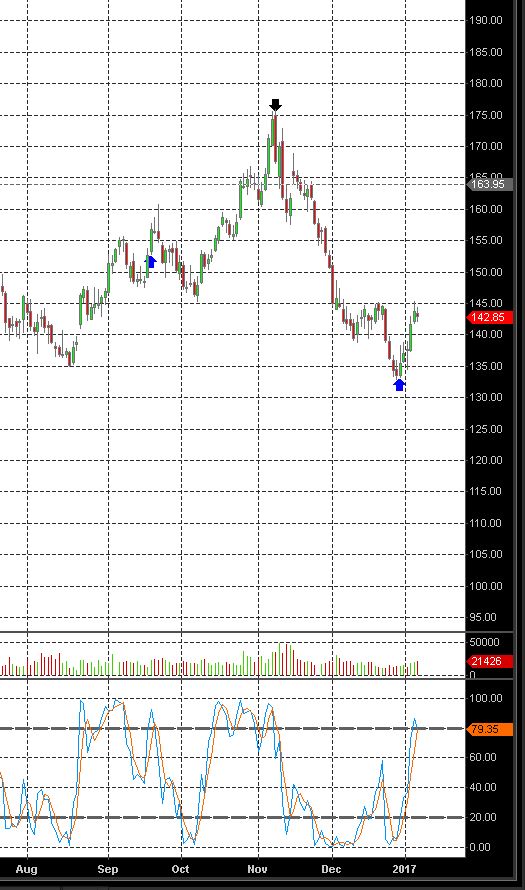
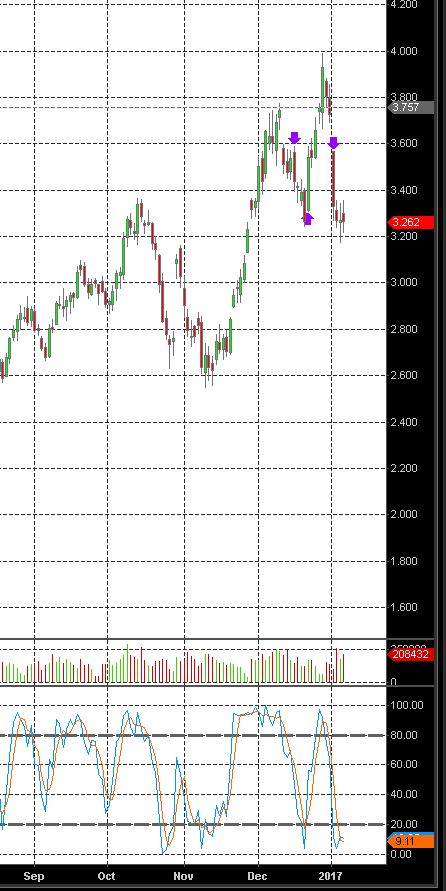
5. Long March Coffee
as per the recent blue up arrow Dec 29th. Coffee has been very oversold.