
It has been some time since the last post.
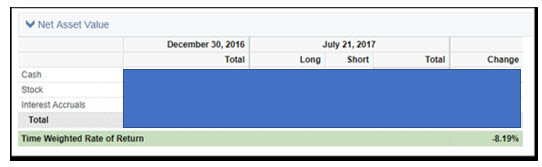
I am therefore displaying monthly performance and YTD MST performance.
Time-weighted return YTD = -8.2%.
As systematic traders, undergoing drawdown is part of the trading process and to be expected. MST month of January realized some highly variant signalling in the Lumber market, which up until 2017 hadn’t lost more than 3 consecutive trades going back to 2006. This scenario occurred no more than 4 times over 11 years of data. Not to mention the infrequent scenario involving 2 consecutive losses, which occurred 6 times over 11 years. Overall, Lumber generates a 65% win rate over 250 trades and 11 years of data. However, Lumber underwent a negative ‘skew’, losing 7 consecutive trades and 11 of 12 signals in January. This market contributes to the volatile month of January, starting the year off in a deep hole, which has slowly been recouped in the low Vol market environment of 2017. The key as a systematic trader is to stay with the program, with the trades, not to deviate, or derail, as the next sequence of signals ‘may’ be opportunities to recoup losses. And if those are missed, then its opportunity cost to the trader, that will impact P/L, performance and track record.
I have been busy analyzing data sets, looking to incorporate new markets in 2017. I will keep you posted.
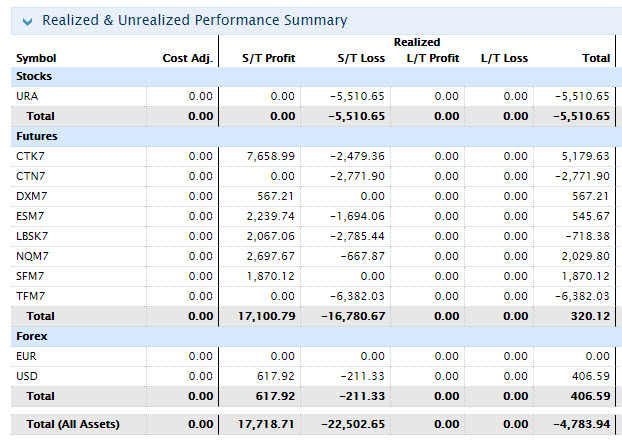
January Trading Summary: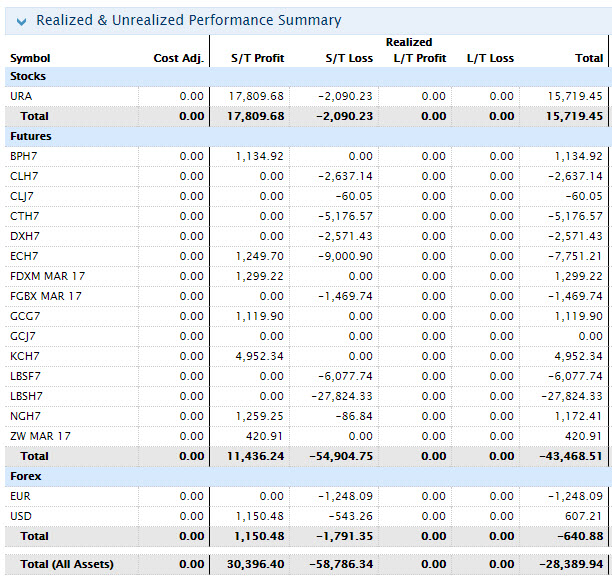
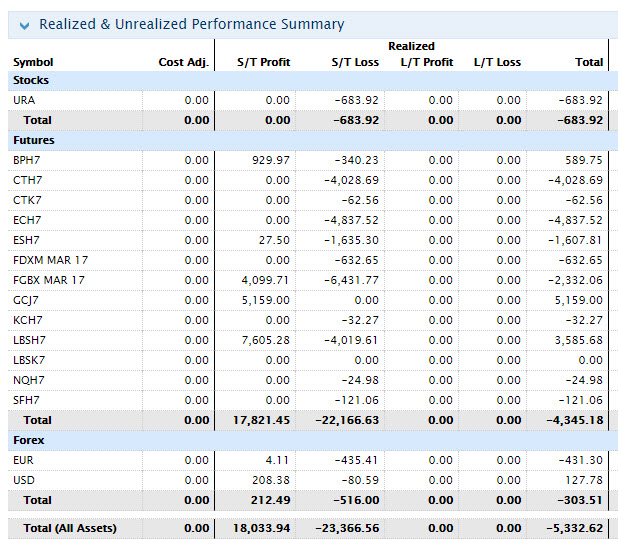
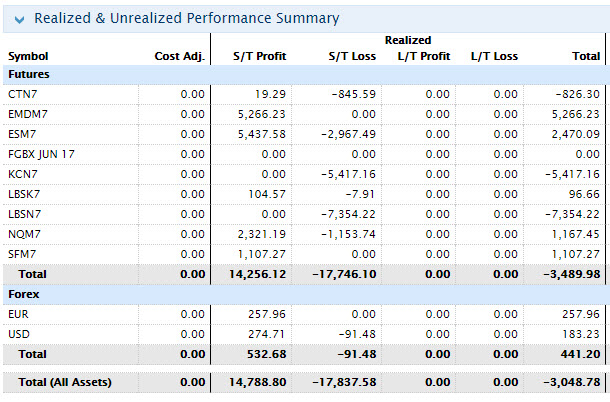
Feb Trading Performance:
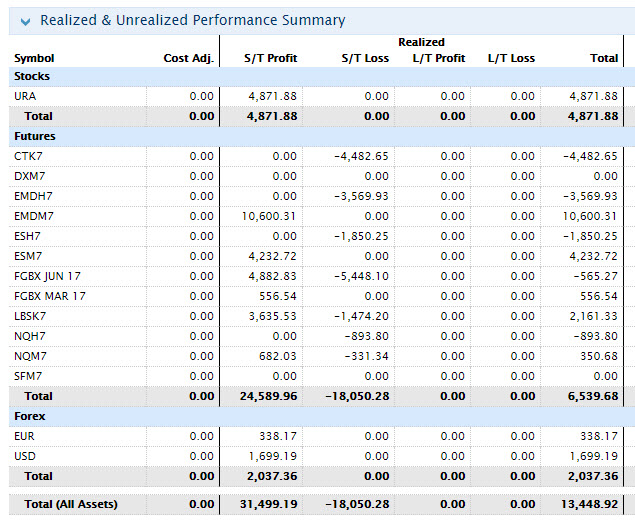
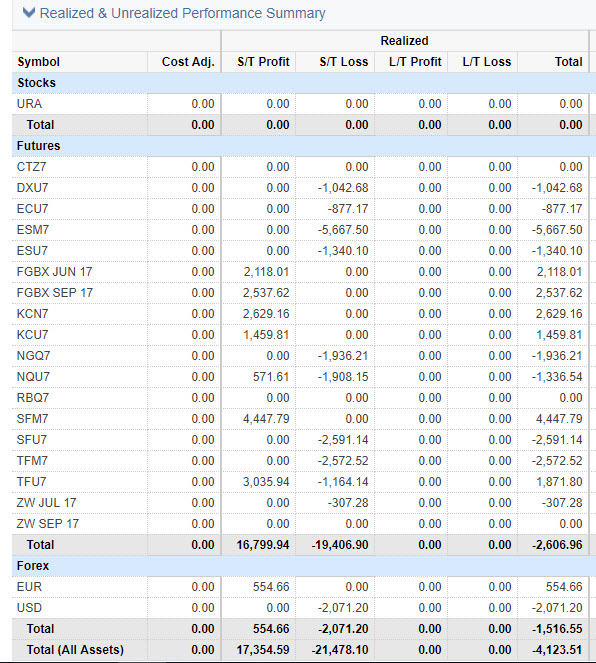
March Performance:
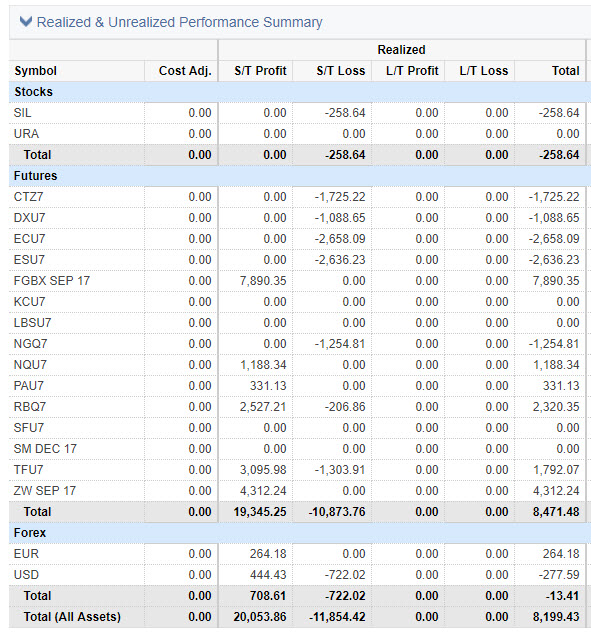
April Performance:
May Performance:
June Performance:
July Performance (month-to-date):
2017 YTD Performance (Realized):