The MST program can be used as an integrated multi-strategy program. Commonly the signals are taken and traded as a ‘stop-and-reverse’ (SAR) system, however, by implementing additional indicators from longer timeframes (or shorter term), the system can be modified to support anticipated or changing market conditions. Based on the seasonal (July) price history, Gasoline has trended in 8/11 previous trading years (up or down). This suggests that the market has a propensity to move directionally in the summer months (specifically July). To this, I have adapted two weekly momentum indicators to add another layer that supported the decision to more aggressively ‘buy’ the market. Although these latter factors are subjective interpretations of market data, as the intra-day chart will show, MST signalling demonstrated the markets inherent upward bias for the month of July.

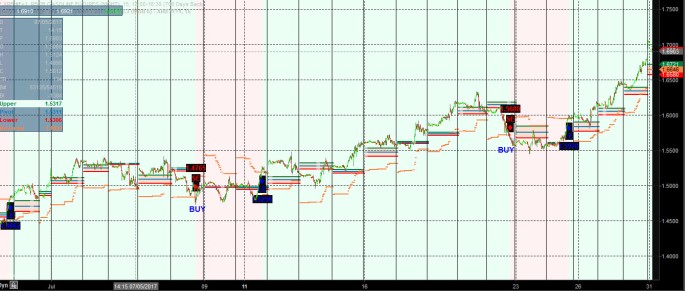
The above is the intraday chart of July Gasoline (XRB N7), showing ‘program’ generated signals (SE/LE overlay).
SE = Short Entry, LE = Long Entry. Implying long and short trade entries accordingly.
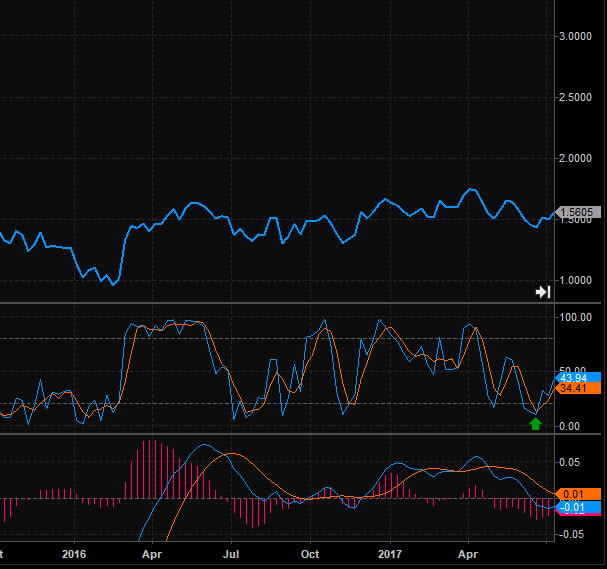
As mentioned, the SE was adapted as a long signal (mean reversion) entry, where I bought the market (as opposed to selling as the signal suggests). Moreover, there were 2 buying opportunities in July – corresponding to the 2 ‘SE’s. Also, we can observe the ‘behavior’ of the market as it relates to the signalling, whereby, consecutive signals (SE followed by a next day LE) were generated, further suggesting the more ‘imbedded’ nature of the developing long-trend. Conventionally, ‘stop-and-reverse’ trading would trade these signals as plain vanilla individual long and short entries as they were delivered. But if we look at the weekly chart below, we can take away some technical nuggets that were suggesting a possible price breakout.

Going into July, we can see that Gasoline was oversold on the weekly as per the mid-panel and green arrow showing the weekly stochastic below the critical ’20’ level. Into the end of June, the same panel shows the faster weekly crossover from oversold territory, indicating a monthly ‘up-trend’ had a higher probability of occurrence. This in turn prompted the transition to a buy only strategy and a modification of the conventional signalling as mentioned.

