Using MST Signals in Seasonal Gasoline

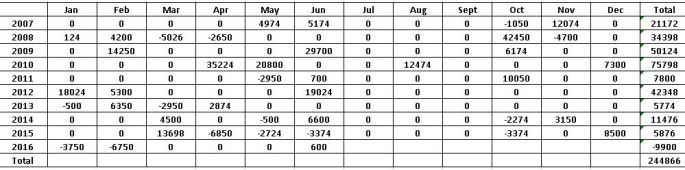
The MST program can be used as an integrated multi-strategy  program.  Commonly the signals are taken and traded as a ‘stop-and-reverse’ (SAR) system, however, by implementing additional indicators from longer timeframes (or shorter term), the system can be modified to support anticipated or changing market conditions. Based on the seasonal (July) price history, Gasoline has trended in 8/11 previous trading years (up or down). This suggests that the market has a propensity to move directionally in the summer months (specifically July). To this, I have adapted two weekly momentum indicators to add another layer that supported the decision to more aggressively ‘buy’ the market. Although these latter factors are subjective interpretations of market data, as the intra-day chart will show, MST signalling demonstrated the markets inherent upward bias for the month of July.

2017-07-31_7-22-41

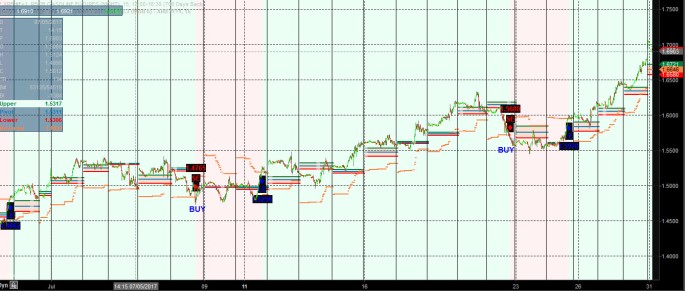
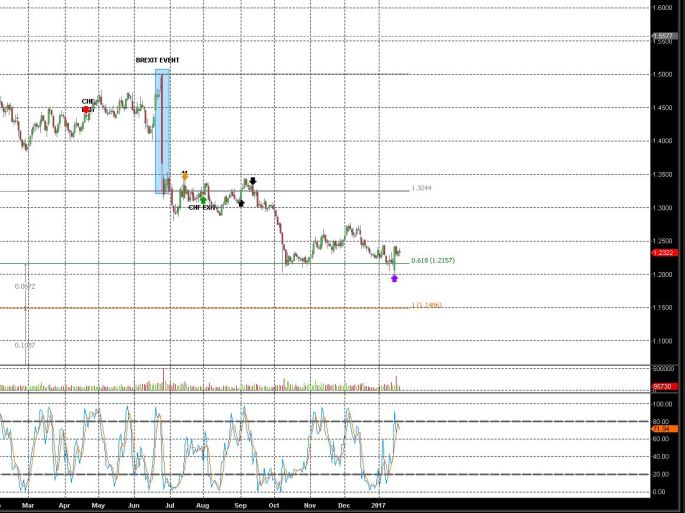
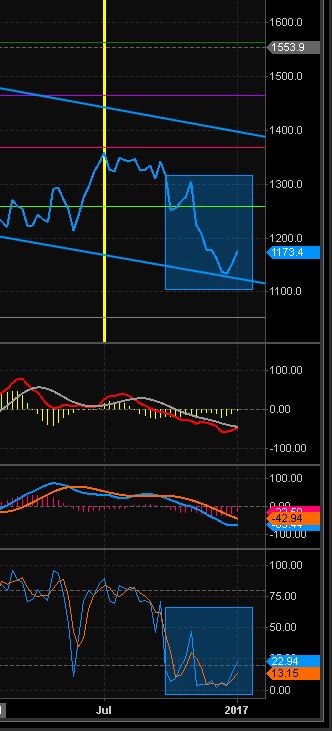
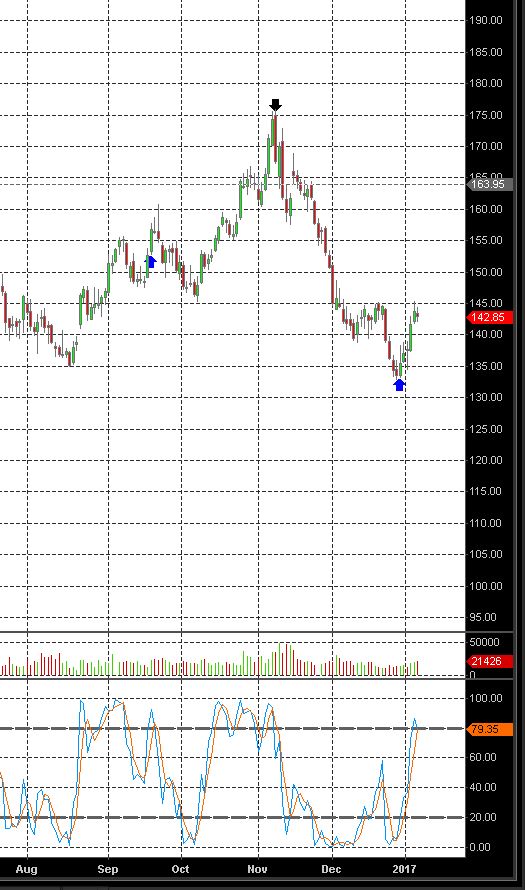
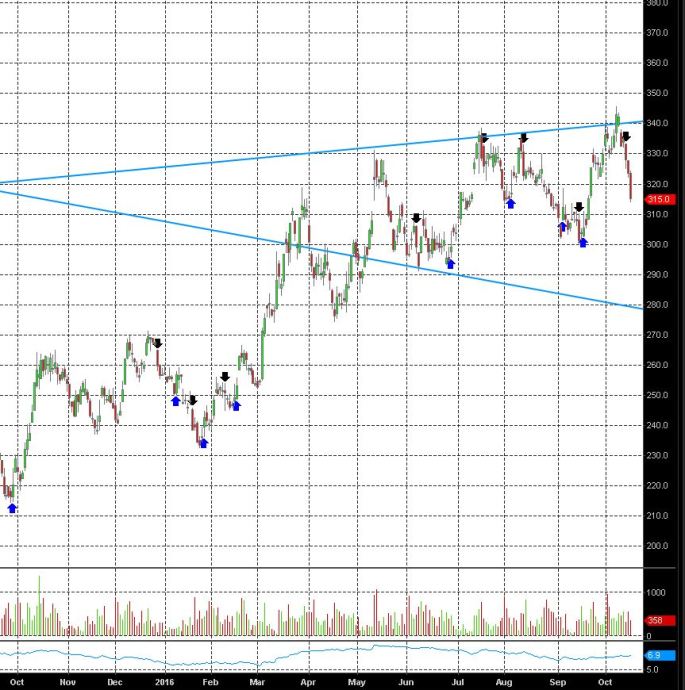
The above is the intraday chart of July Gasoline (XRB N7), showing ‘program’ generated signals (SE/LE overlay).

SE = Short Entry, LE = Long Entry. Implying long and short trade entries accordingly.

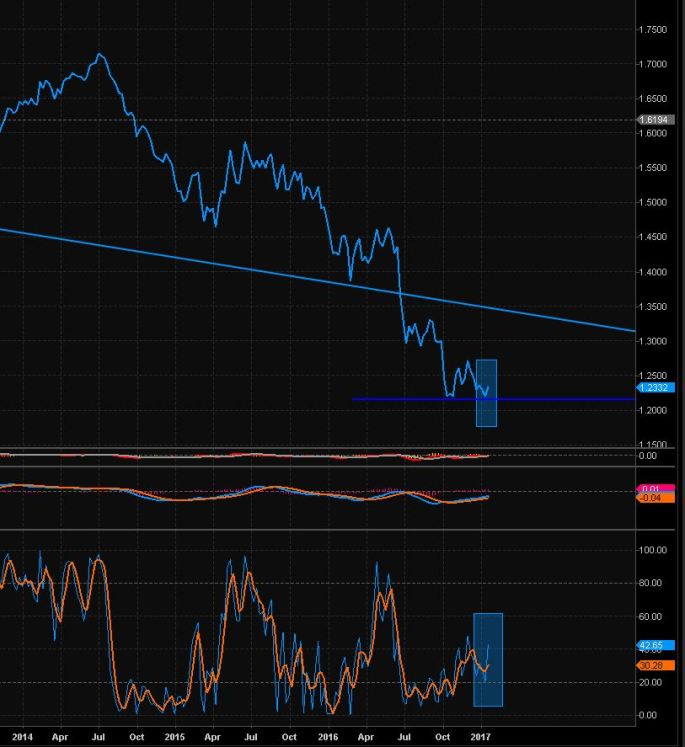
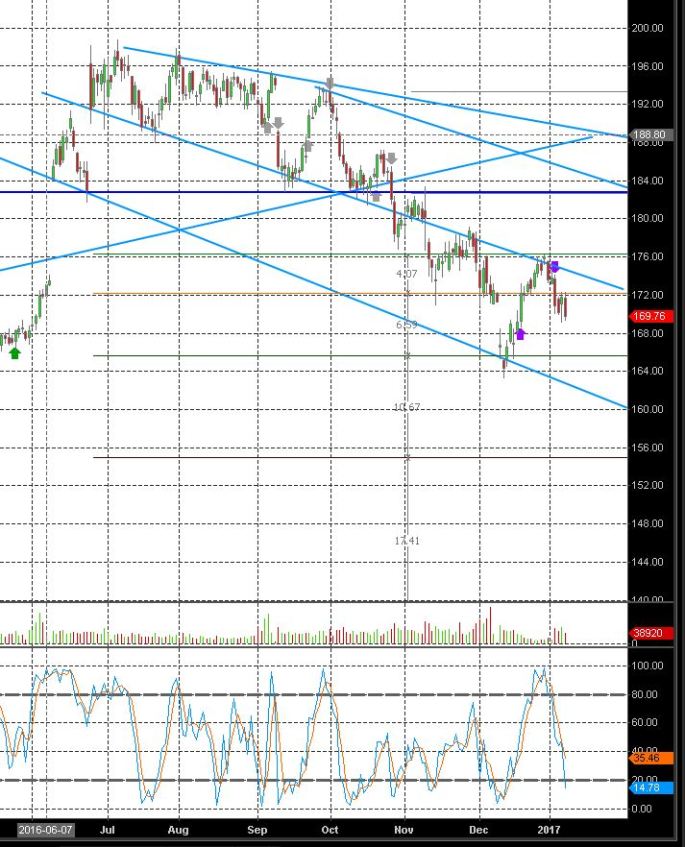
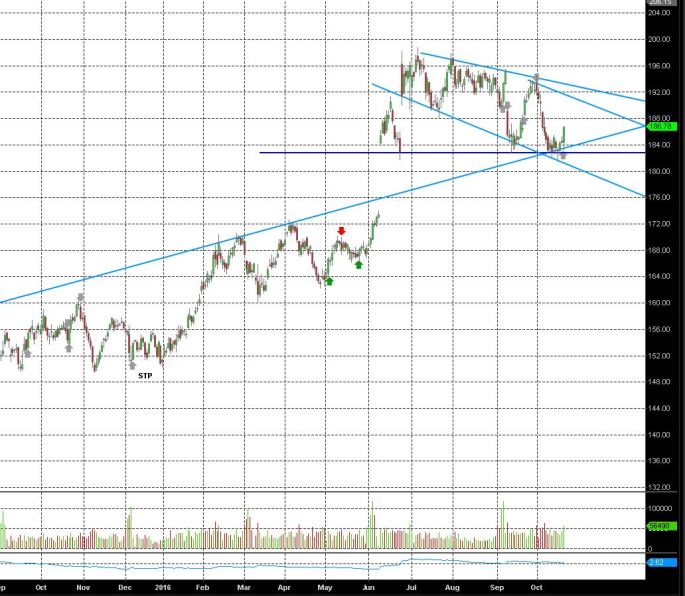
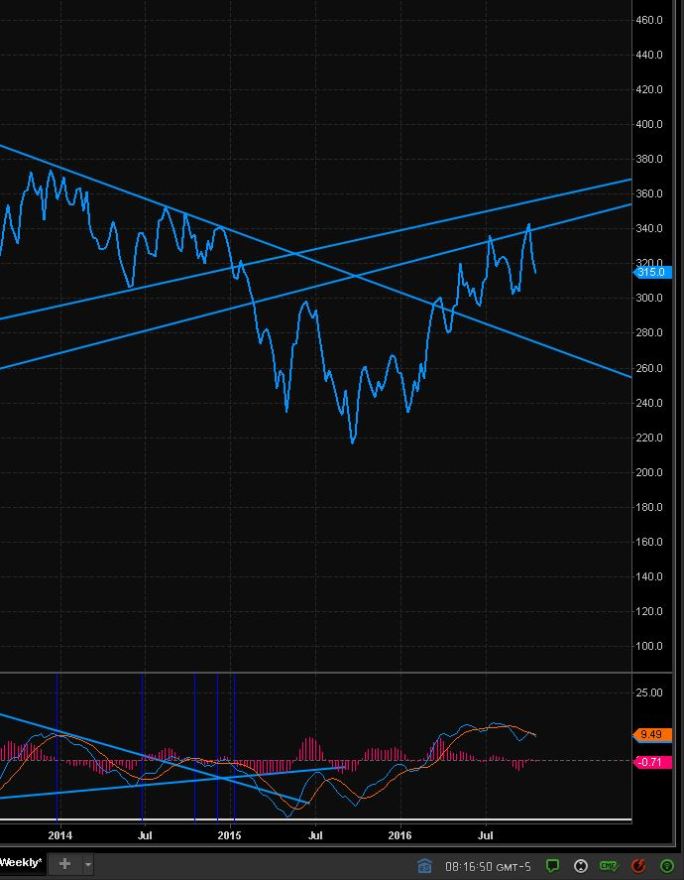
As mentioned, the SE was adapted as a long signal (mean reversion) entry, where I bought the market (as opposed to selling as the signal suggests). Moreover, there were 2 buying opportunities in July – corresponding to the 2 ‘SE’s. Also, we can observe the ‘behavior’ of the market as it relates to the signalling, whereby, consecutive signals (SE followed by a next day LE) were generated, further suggesting the more ‘imbedded’ nature of the developing long-trend. Conventionally, ‘stop-and-reverse’ trading would trade these signals as plain vanilla individual long and short entries as they were delivered.  But if we look at the weekly chart below, we can take away some technical nuggets that were suggesting a possible price breakout.

2017-07-31_7-35-34

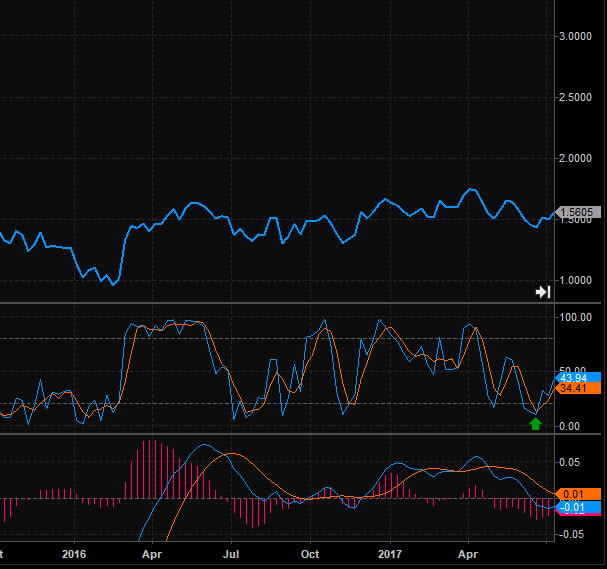
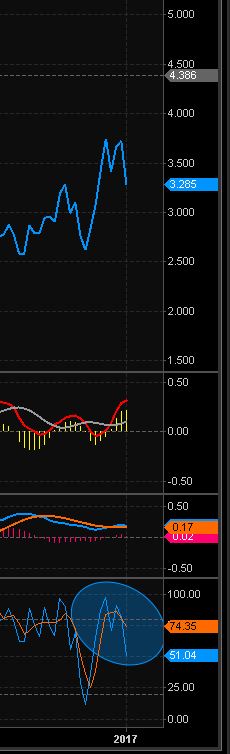
Going into July, we can see that Gasoline was oversold on the weekly as per the mid-panel and green arrow showing the weekly stochastic below the critical ’20’ level. Into the end of June, the same panel shows the faster weekly crossover from oversold territory, indicating a monthly ‘up-trend’ had a higher probability of occurrence. This in turn prompted the transition to a buy only strategy and a modification of the conventional signalling as mentioned.


YTD Trading Performance

It has been some time since the last post.

I am therefore displaying monthly performance and YTD MST performance.

Time-weighted return YTD = -8.2%.

As systematic traders, undergoing drawdown is part of the trading process and to be expected. MST month of January realized some highly variant signalling in the Lumber market, which up until 2017 hadn’t lost more than 3 consecutive trades going back to 2006. This scenario occurred no more than 4 times over 11 years of data. Not to mention the infrequent scenario involving 2 consecutive losses, which occurred 6 times over 11 years. Overall, Lumber generates a 65% win rate over 250 trades and 11 years of data. However, Lumber underwent a negative ‘skew’, losing 7 consecutive trades and 11 of 12 signals in January. This market contributes to the volatile month of January, starting the year off in a deep hole, which has slowly been recouped in the low Vol market environment of 2017. The key as a systematic trader is to stay with the program, with the trades, not to deviate, or derail, as the next sequence of  signals ‘may’ be opportunities to recoup losses. And if those are missed, then its opportunity cost to the trader, that will impact P/L, performance and track record.

I have been busy analyzing data sets, looking to incorporate new markets in 2017. I will keep you posted.

January Trading Summary:Jan.jpg

Feb Trading Performance:

Feb.jpg

March Performance:

March.jpg

April Performance:

April.jpg

May Performance:

May.jpg

June Performance:

June.jpg

July Performance (month-to-date):

July.jpg

2017 YTD Performance (Realized):

YTD Revised.jpg


Long British Pound (6B H7)

This has been the month of contrarian trades set-ups in the portfolio; Long Gold, Long Eurocurrency, Long Coffee + Lumber, Long Uranium ETF (URA) – still short German BUXL  (German Long Bond). To this heap of contrarian signals, I added long British Pound futures earlier this week. Let’s take a look at it:

We have the day chart of the British Pound futures below: since the BREXIT event day candle, the market has traded progressively lower – as per the blue overlay highlighting the event driven day. Extending the Fib overlay delivers trade expectations on the way down. The market seems to be finding some support at the 61.8% extension level (1.21) – and this serves as my risk in the current long trade set up as per the MST signal (purple up arrow). My portfolio is geared against the more mainstream thought-process of a continued strong USD Index – which may prove to be the correct side of the trade. I say this as I observe the relentless push to newer new highs across the US Equity space, to which the USD Index is directly correlated. As long as the bid for US equities persists, the USD may go higher as well. Though, I am trading the program, and I am currently in active months for the Pound + Euro – which is correlated – yet still I like the R/R from the long side.

GBR.JPG

I’ve posted up the weekly chart of the Pound below; closing line chart shows a triple bottom at the 1.22 closing price. So any weekly and or multi-day closing below this signifies renewed weakness down to the $1.14 level. What I like from this long position is the proximity to risk (exit ~.02 cents) and the more recent weekly bullish crossover in the 3 week (blue) fast stochastic with acceleration to the upside, in concert with the upturn in the slow (orange) 14 week stochastic – as per the blue overlay boxed out lower panel data. This type of technical display could suggest some unwinding of the short GBR trade.

gbr1

Portfolio Update; Jan 2017

MST program has experienced several signals into the new trading year.

Current open positions:Capture.JPG

To overview recent futures signals below:

1.Long Feb Gold:

GC.JPG

This long signal was entered for the Jan ‘seasonal’ trading as per MST monthly trading schedule and as per the recent ‘purple up arrow’ shown in the day chart above. Gold is taking a bounce off the long term down downtrend line dating back to the market top in Dec 2011. The gold phase-shifted above this resistance in early 2016 and is now trading using this as a technical support level. I’m not thrilled about the trade location off this recent bounce, but I’m in the market with small exposure for now. I still like this long position for now as the market may need to unwind the oversold condition as per the weekly stochastic below:

GCW.JPG

The weekly stochastic indicator boxed out above and corresponding to the weekly line chart in the continuous gold futures is suggesting the market should mean revert short-intermediate term. The weekly stochastic has remained depressed below the ’20’ level implying a very oversold condition since August 2016. And this is the most prolonged oversold weekly stochastic condition since the 2011 downtrend in gold began.

2.Long March Euro-currency Futures: 

In line with the contrarian trade, I am long the Euro-currency for the first time since Sep 2016:

6E1.JPG

From the day chart above, the Euro continuous futures has been in a long-term bracketing pattern since the March 2015 low at the 1.05 level. I wrote on this market last in Oct, when the BREXIT bar low was threatening to breakdown on Nov 9th, suggesting the Euro could revert back to the 1.05 level. The Fib-Extension overlay above helped to generate trade expectation as the market broke the BREXIT bar low, on a expansion bar, indicated by the most recent ‘purple down arrow’. This trade was recently booked and reversed with a long entry as per the most recent ‘purple up arrow’ yesterday. The breakout in the Euro corresponded to the recent breakdown in the USD Index, which due for a pull-back.

3. Short March BUXL Futures (German Long bond Futures):

I have renewed my short position in the BUXL futures as per the day chart below:

I bought the most recent bounce off the long extended down-trend line, reflected by the recent purple up-arrow, which was a flat trade, as the BUXL reversed to the downside (most recent purple down arrow). This market is getting progressively weaker as can be visualized by the reversion to the first down-trend line in late Nov and now again in late Dec/early Jan, and unable to phase shift back higher and instead the market moves back lower, threatening to revert to previous support at the 164 level.

I still think it is likely we may see a mean reversion in the FI space (back to the upside) and this market may be in the process of forming a base/double bottom at this level and could head higher.

BX.JPG

In the Commodity space MST is Short Nat Gas March Futures, Long Jan Lumber, Long March Coffee: I have copied charts below with recent arrows noting current trades.

4.Short March Nat Gas:

NG.JPG

We have the breakdown in the weekly Stochastic in NG as per the weekly line chart below suggesting possible continued short term weakness.

ngw

5. Long March Coffee

as per the recent blue up arrow Dec 29th. Coffee has been very oversold.

KC1.JPG


Short Alert: EUROCURRENCY (6E Z6)

MST generated a short signal in the Eurocurrency this morning as well. I’m not thrilled about the trade location on this, but I like the Dollar Index chart from the long side, with what appears to be a technical breakout and closing high today > 98 level, suggesting a re-test of par. This would imply continued short-intermediate term weakness – at least until the next FOMC meeting – but I doubt any policy changes are set to take place before the election.

This signal gets triggered right at the support level of the the BREXIT bar (event driven bar), which has basically contained all the price action. The chart looks weak in my view, and the weekly chart is also seeing MACD crossover and breakdown. What would be supportive from the short side near term is a weekly closing < 1.09, which is the previous weekly closing pivot low – if the USD Index closes up the week on a strong note tomorrow, then going into next week, we could expect continuation lower in the EUR. Purely, from a technical Fib Extension overlay perspective, we could see the Eur move towards previous lows at 1.04 level. The chart has been bracketing between 1.14 – 1.04 since Mar 2015 — and so it looks as though if the Eur can close on weekly basis below the BREXIT lows – an important technical candle day – then 1.04 is back on the table as the next stop.

Euro D chart.JPG

I am showing the Eurocurrency historical performance since 2007 below:

Euro Perf.JPG

The Eurocurrency is ‘active’ in the portfolio during the months of March, May, August and October, and has generated the following data:

Total Signals: 45

Win Rate: 69%

Payout: 2.73x

Avg $ Win (1 lot): 5028

Avg $ Loss (1 lot): -1840

Avg $ P/L/Annum: +14,153

The Eurocurrency program has not had a losing year since inception


Buy Alert: BUXL (GBM Z6)

Following the ECB press conference today, several signals were generated; from a technical perspective, the chart for German Long Bonds looked like it was setting up for a rotation – from the recent pull back into 182 level. This morning, GBX went long at 186.16 Dec contract as per the recent ‘up arrow’ on the day chart below; MST generated a confirmation long signal in the French OATs (French Long Gov Bond) – for a combined long signal from the long end of the Euro gov bond-curve – though not confirmed by the US FI space. Here’s a look at the chart below: This long signal sets up for a nice R/R trade, with the signal coming off the consolidation at support in line with previous lows – for a technical triple bottom – for what appears to be a bracketing response in the market, with expectation back to the 190’s.

GBX.JPG

Lumber: Short Trade Optimization

The Lumber trade went short Oct 13, as per the day chart – recent ‘black’ down arrow – indicating the trade entry. Prior to putting on a system-trades, I evaluate whether a given signal has the propensity to asymmetrically perform – ie., did the signal anticipate a big market move.

In evaluating the Lumber market in a previous post, I suggested that 4/14 trades produced the P/L in 2016. So then, what can system traders look for as clues to support say putting on larger size to capture these events with more certainty. Of course there are many indicators that can be applied to filter asymmetric winners. It may plainly be an intuitive response, or derived from fundamentals.

For this particular trade, I am going to look at the weekly momentum MACD to gain some additional information about what may be occurring in the Lumber market, as it relates to the timing of the current short trade.

Lumber.JPG

lumber-weekly-chart


The line-chart (above) from the weekly time-frame has produced higher highs (in price), against a long term up trend line. The lower panel shows momentum divergence from the latest price-high as the ‘slow’ MACD indicator has turned down, not confirming the recent high in price. The fast MACD  crossed over and began trending below the slower MACD from the last decline in price associated with the previous high. This latest high in price had the fast oscillator move back into the slow oscillator, before turning down again. These are strong longer term momentum setups. The Lumber market may be producing a longer term top here.

As it relates to taking system trades, the weekly chart is supportive to the current short position, as the market has been moving higher in price without confirmation. When system signals are ‘sensitive’ to short term changes, watch the longer time-frames to gain insight into your trade confirmation.

Short Alert: Nasdaq100 (NQ Z6)

The MST indicator generated a short signal yesterday on the big decline across the equity space.  Contrary to my previous post, long DAX30, I am now short the US futures, creating a net neutral equity exposure. I find program signalling in the equity space to be very short term volatile. Given the melt-up support for equities, this short position could very easily prove to fail. I placed my stop as per the chart below, just above the pivot high from yesterdays bar.

Looking at the Bond markets, specifically BUXL futures, the market has arrived to a supportive chart location, short term anyway – with space below 182. The BUXL has had a big move down from the ~195 level. I have been short since 9/30 and its looking like this trade may be ‘too short’ near term. If the bonds continue to bail, ie., BUXL < 182 on daily closing basis, the stocks are going higher. If the BUXL finds support, we could see some erosion in the DAX30 futures.

On a different note, I like the ‘feel’ of the soft commodity space from the long side; Cotton/Lumber/Coffee. I am currently long Lumber and Coffee.  The energy space, with Oil currently in ‘seasonal trading’ for the MST program generated a long signal yesterday. I don’t like the trade location right now, with Oil having moved up from ~$42 in the past 3 weeks – so I’m watching it. But, the commodity space (softs) are long trades in my program, suggesting a risk-on feel, still. Then having said that, everything could dump real quick. As it relates to my program in 2016, with asset conditions having generally been volatile, range-bound markets, there have been frequent inflection points/directional changes – reflecting complete lack of volatility./certainty – which has made for navigating some tougher trading this year.

nq

Buy Alert: DAX30 (FDAX Z6)

The DAX30 equity-linked futures is in seasonal trading, as per the monthly trading schedule. I have posted the day chart of the continuous futures contract for the DAX30 below, with the latest ‘long signal’ as per the green arrow. The DAX30 is consolidating below the previous day-chart up-trend line, which is posing resistance for the market.

DAX day.JPG

The weekly line chart adds more information, displayed below. The DAX30 experienced a heavy pull-back from a blow-off top into early 2016, and has since climbed above the recent weekly down-trend line, and looks to be in a high-level contraction. The lower panel shows weekly MACD crossover (12, 26 week) in bullish alignment – the faster 12-week indicator has pulled back into the slower 26-week MACD line – confirming a weekly contraction in momentum. The weekly momentum pullback in the context of a bullish intermediate directional trend may prove to be optimal trade locations. The bigger question is whether the DAX30 can follow the US equities higher, given its relative underperformance. This would also suggest that the BUXL (German Bonds) should get weaker from here as well. However, the BUXL has already posted a large downside corrective move in price over the past 2 weeks and comes back to support at the 182 level, below which there is a lot of space on the chart. If the BUXL breaks down further from here, the DAX30 will go higher. With a weekly stop a 10,400, the position risk justifies the exposure.

WEEKLY DAX.JPG